Explorations in Pediatric Drug Safety

montelukast-associated systematic disorders

Published

December 29, 2022

In this post, I am looking into something that I have been wanting to look into for a while. This short notebook shows a mini investigation into work I did during my PhD.

library(tidyverse)
── Attaching core tidyverse packages ──────────────────────── tidyverse 2.0.0 ──
✔ dplyr     1.1.2     ✔ readr     2.1.4
✔ forcats   1.0.0     ✔ stringr   1.5.0
✔ ggplot2   3.4.3     ✔ tibble    3.2.1
✔ lubridate 1.9.2     ✔ tidyr     1.3.0
✔ purrr     1.0.2     
── Conflicts ────────────────────────────────────────── tidyverse_conflicts() ──
✖ dplyr::filter() masks stats::filter()
✖ dplyr::lag()    masks stats::lag()
ℹ Use the conflicted package (<http://conflicted.r-lib.org/>) to force all conflicts to become errors
library(data.table)

Attaching package: 'data.table'

The following objects are masked from 'package:lubridate':

    hour, isoweek, mday, minute, month, quarter, second, wday, week,
    yday, year

The following objects are masked from 'package:dplyr':

    between, first, last

The following object is masked from 'package:purrr':

    transpose
theme_set(theme_bw())
kidsides::download_sqlite_db()
Already exists: /Users/nickgiangreco/Library/Caches/org.R-project.R/R/kidsides/effect_peds_19q2_v0.3_20211119.sqlite
con <- kidsides::connect_sqlite_db()

In this notebook, I want to investigate more into a claim I made in my paper on pediatric drug safety:

We investigate the relationship between development stage and known pediatric drug effects, such as montelukast-induced psychiatric disorders, where we found a significant signal (odds ratio 8.77 [2.51, 46.94]) within the second year of life.

Now I’m not disputing this claim, I actually have this enrichment in the database I created:

tbl(con,"ade_nichd_enrichment") %>% 
    filter(nichd=="toddler" &
               atc_concept_name=="montelukast" &
               meddra_concept_name=="Psychiatric disorders") %>% 
    collect()
# A tibble: 1 × 15
  category atc_concept_name meddra_concept_name   nichd   atc_concept_class_id
  <chr>    <chr>            <chr>                 <chr>   <chr>               
1 soc_atc5 montelukast      Psychiatric disorders toddler ATC5                
# ℹ 10 more variables: meddra_concept_class_id <chr>, a <int>, b <int>,
#   c <int>, d <int>, lwr <dbl>, odds_ratio <dbl>, upr <dbl>, pvalue <dbl>,
#   fdr <dbl>

The odds of 8.7708426 indicates a large association of statistically significant reporting of montelukast-induced Psychiatric disorders for toddlers.

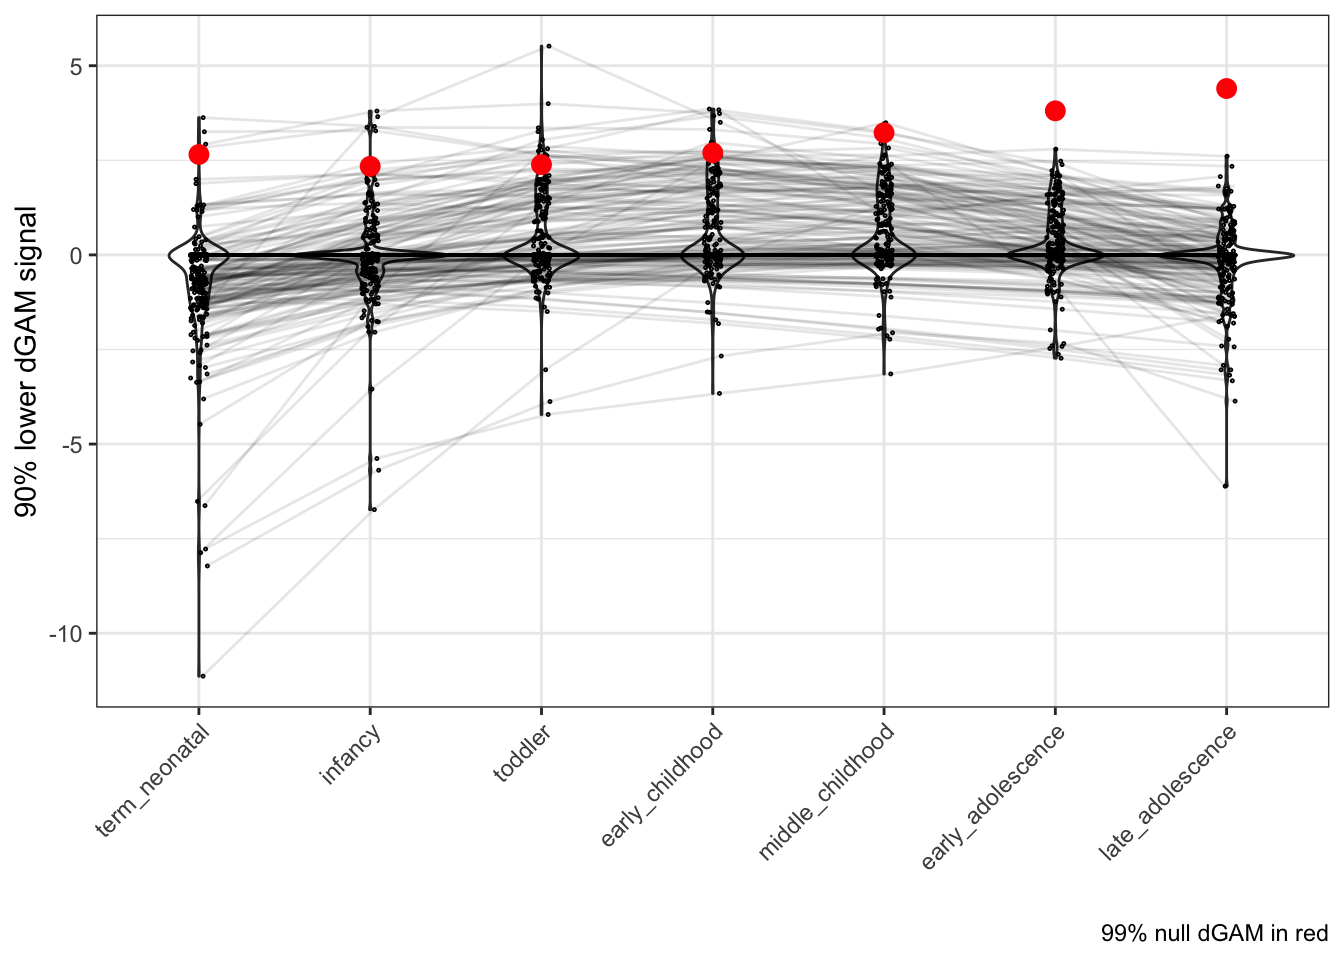
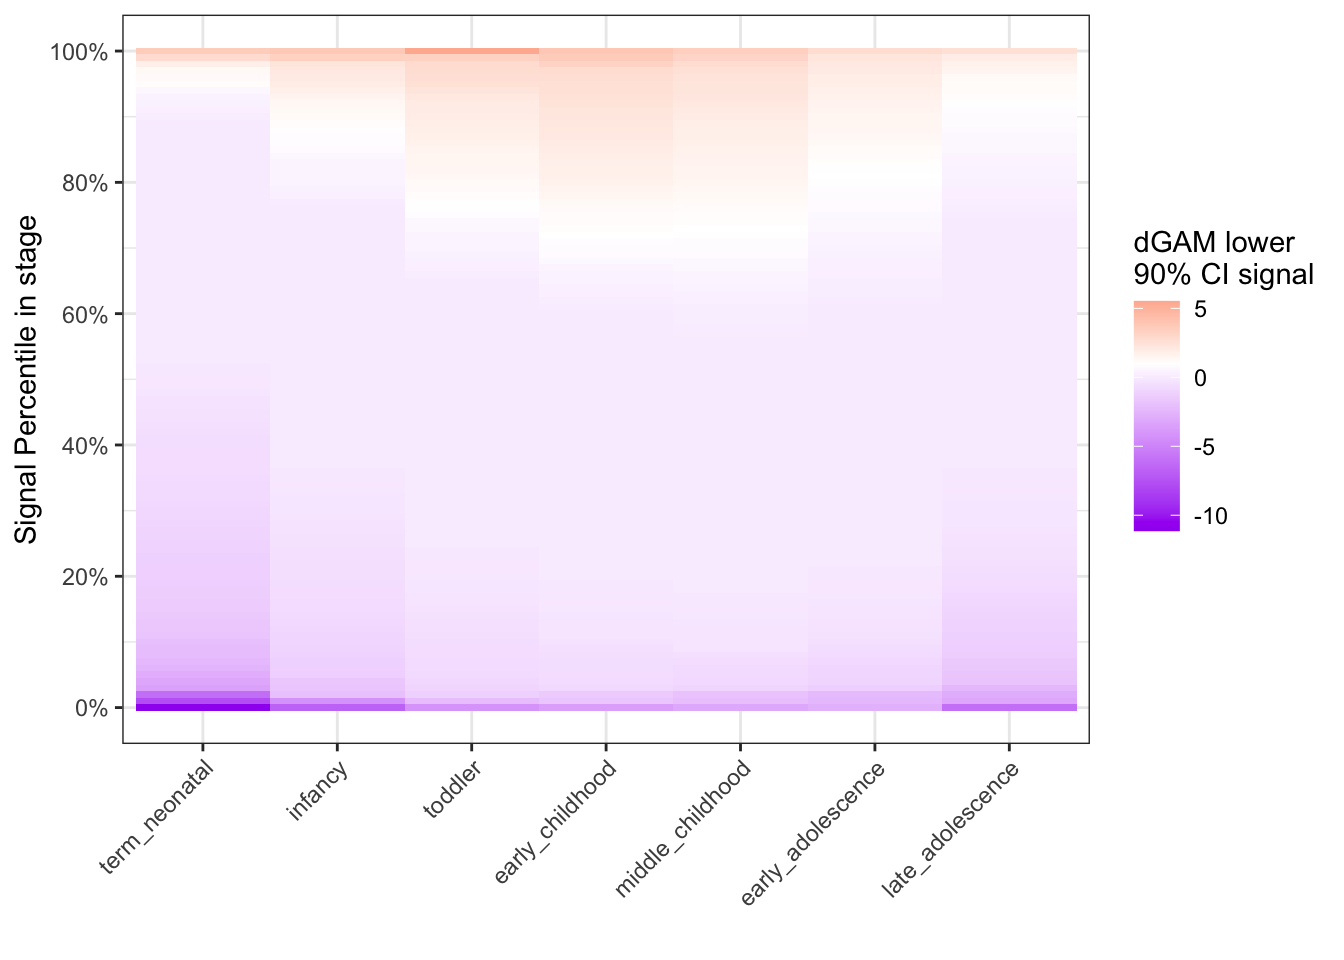
But, these statistics were generated using a null threshold declaring significance. I’m interested to evaluate montelukast and Psychiatric disorders having larger signal at a particular stage. Here’s my visualizations to attempt to evaluate this:

montelukast_drug_info <- tbl(con,"drug") %>%
collect() %>%
filter(grepl("montelukast",atc_concept_name))

psych_disorder_ids <- tbl(con,"event") %>%
collect() %>%
filter(grepl("Psych",meddra_concept_name_4)) %>%
pluck('meddra_concept_id')

pos <- 
    position_dodge2(width=0.1)

tbl(con,"ade_nichd") %>% 
    filter(atc_concept_id==!!pluck(montelukast_drug_info,"atc_concept_id") &
               meddra_concept_id %in% !!psych_disorder_ids) %>% 
    collect() %>% 
    mutate(
        nichd = factor(nichd,levels=unique(nichd))
    ) %>% 
    ggplot(aes(nichd,gam_score_90mse)) +
    geom_violin() +
    geom_point(pch=21,size=0.2,
               position = pos) +
    geom_line(aes(group=ade),alpha=0.1,
              position = pos) +
    geom_point(
        data=tbl(con,"ade_null") %>% 
            collect(),
        aes(nichd,null_99),
        size=3,color="red",
               position = pos) +
    theme(
        axis.text.x = element_text(angle=45,vjust=1,hjust=1)
    ) +
    labs(x="",y="90% lower dGAM signal",caption = "99% null dGAM in red")

probs <- seq(0,1,0.01)
tbl(con,"ade_nichd") %>% 
    filter(atc_concept_id==!!pluck(montelukast_drug_info,"atc_concept_id") &
               meddra_concept_id %in% !!psych_disorder_ids) %>% 
    collect() %>% 
    mutate(
        nichd = factor(nichd,levels=unique(nichd))
    ) %>% 
    group_by(nichd) %>% 
    summarise(q = list(probs),
              qs = 
                  list(quantile(gam_score_90mse,probs = probs))
              ) %>% 
    unnest(c("qs","q")) %>% 
    ggplot(aes(nichd,q,fill=qs)) +
    geom_tile() +
    scale_y_continuous(labels = scales::percent,
                       breaks = scales::pretty_breaks(6)) +
    scale_fill_gradient2(low = "purple",
                         midpoint = 1,high = "red") +
    labs(y="Signal Percentile in stage",x="") +
    guides(fill=guide_colorbar(title="dGAM lower\n90% CI signal")) +
    theme(
        axis.text.x = element_text(angle=45,vjust=1,hjust=1)
    )

probs <- seq(0.8,1,0.01)
tbl(con,"ade_nichd") %>% 
    filter(atc_concept_id==!!pluck(montelukast_drug_info,"atc_concept_id") &
               meddra_concept_id %in% !!psych_disorder_ids) %>% 
    collect() %>% 
    mutate(
        nichd = factor(nichd,levels=unique(nichd))
    ) %>% 
    group_by(nichd) %>% 
    summarise(q = list(probs),
              qs = 
                  list(quantile(gam_score_90mse,probs = probs))
              ) %>% 
    unnest(c("qs","q")) %>% 
    left_join(
        tbl(con,"ade_null") %>% 
            collect(),
        by="nichd"
    ) %>% 
    mutate(
        nichd = factor(nichd,levels=unique(nichd)),
        above_null_99 = qs>null_99
    ) %>% 
    ggplot(aes(nichd,q,fill=above_null_99)) +
    geom_tile() +
    scale_y_continuous(labels = scales::percent,
                       breaks = scales::pretty_breaks(6)) +
    scale_fill_brewer(palette = "Set1",direction = -1) +
    labs(y="Signal Percentile in stage",x="") +
    theme(
        axis.text.x = element_text(angle=45,vjust=1,hjust=1)
    )

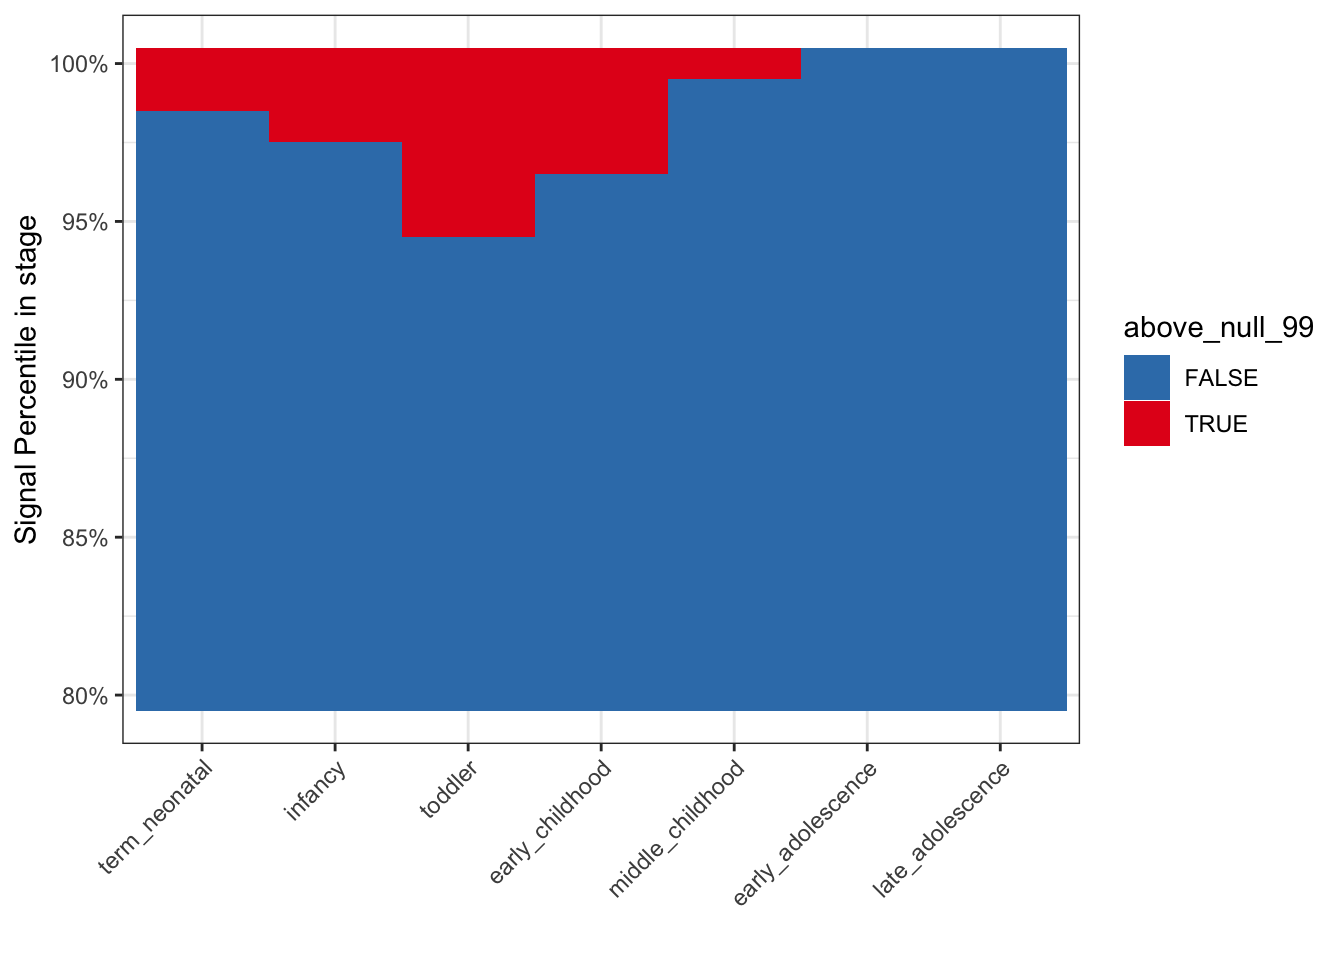
From these, we can see how there are large, outlier scores for montelukast induced Psychiatric disorders at the toddler stage. The score distributions are similar across toddler and childhood stages, though. Nevertheless, the last graph shows that the signals in the toddler stage are above the null 99% scores in a larger proportion of the signal distribution. So empirically, we do see that montelukast-induced Psychiatric disorders are more likely (i.e. have larger, nonrandom signal) at the toddler stage of child development.

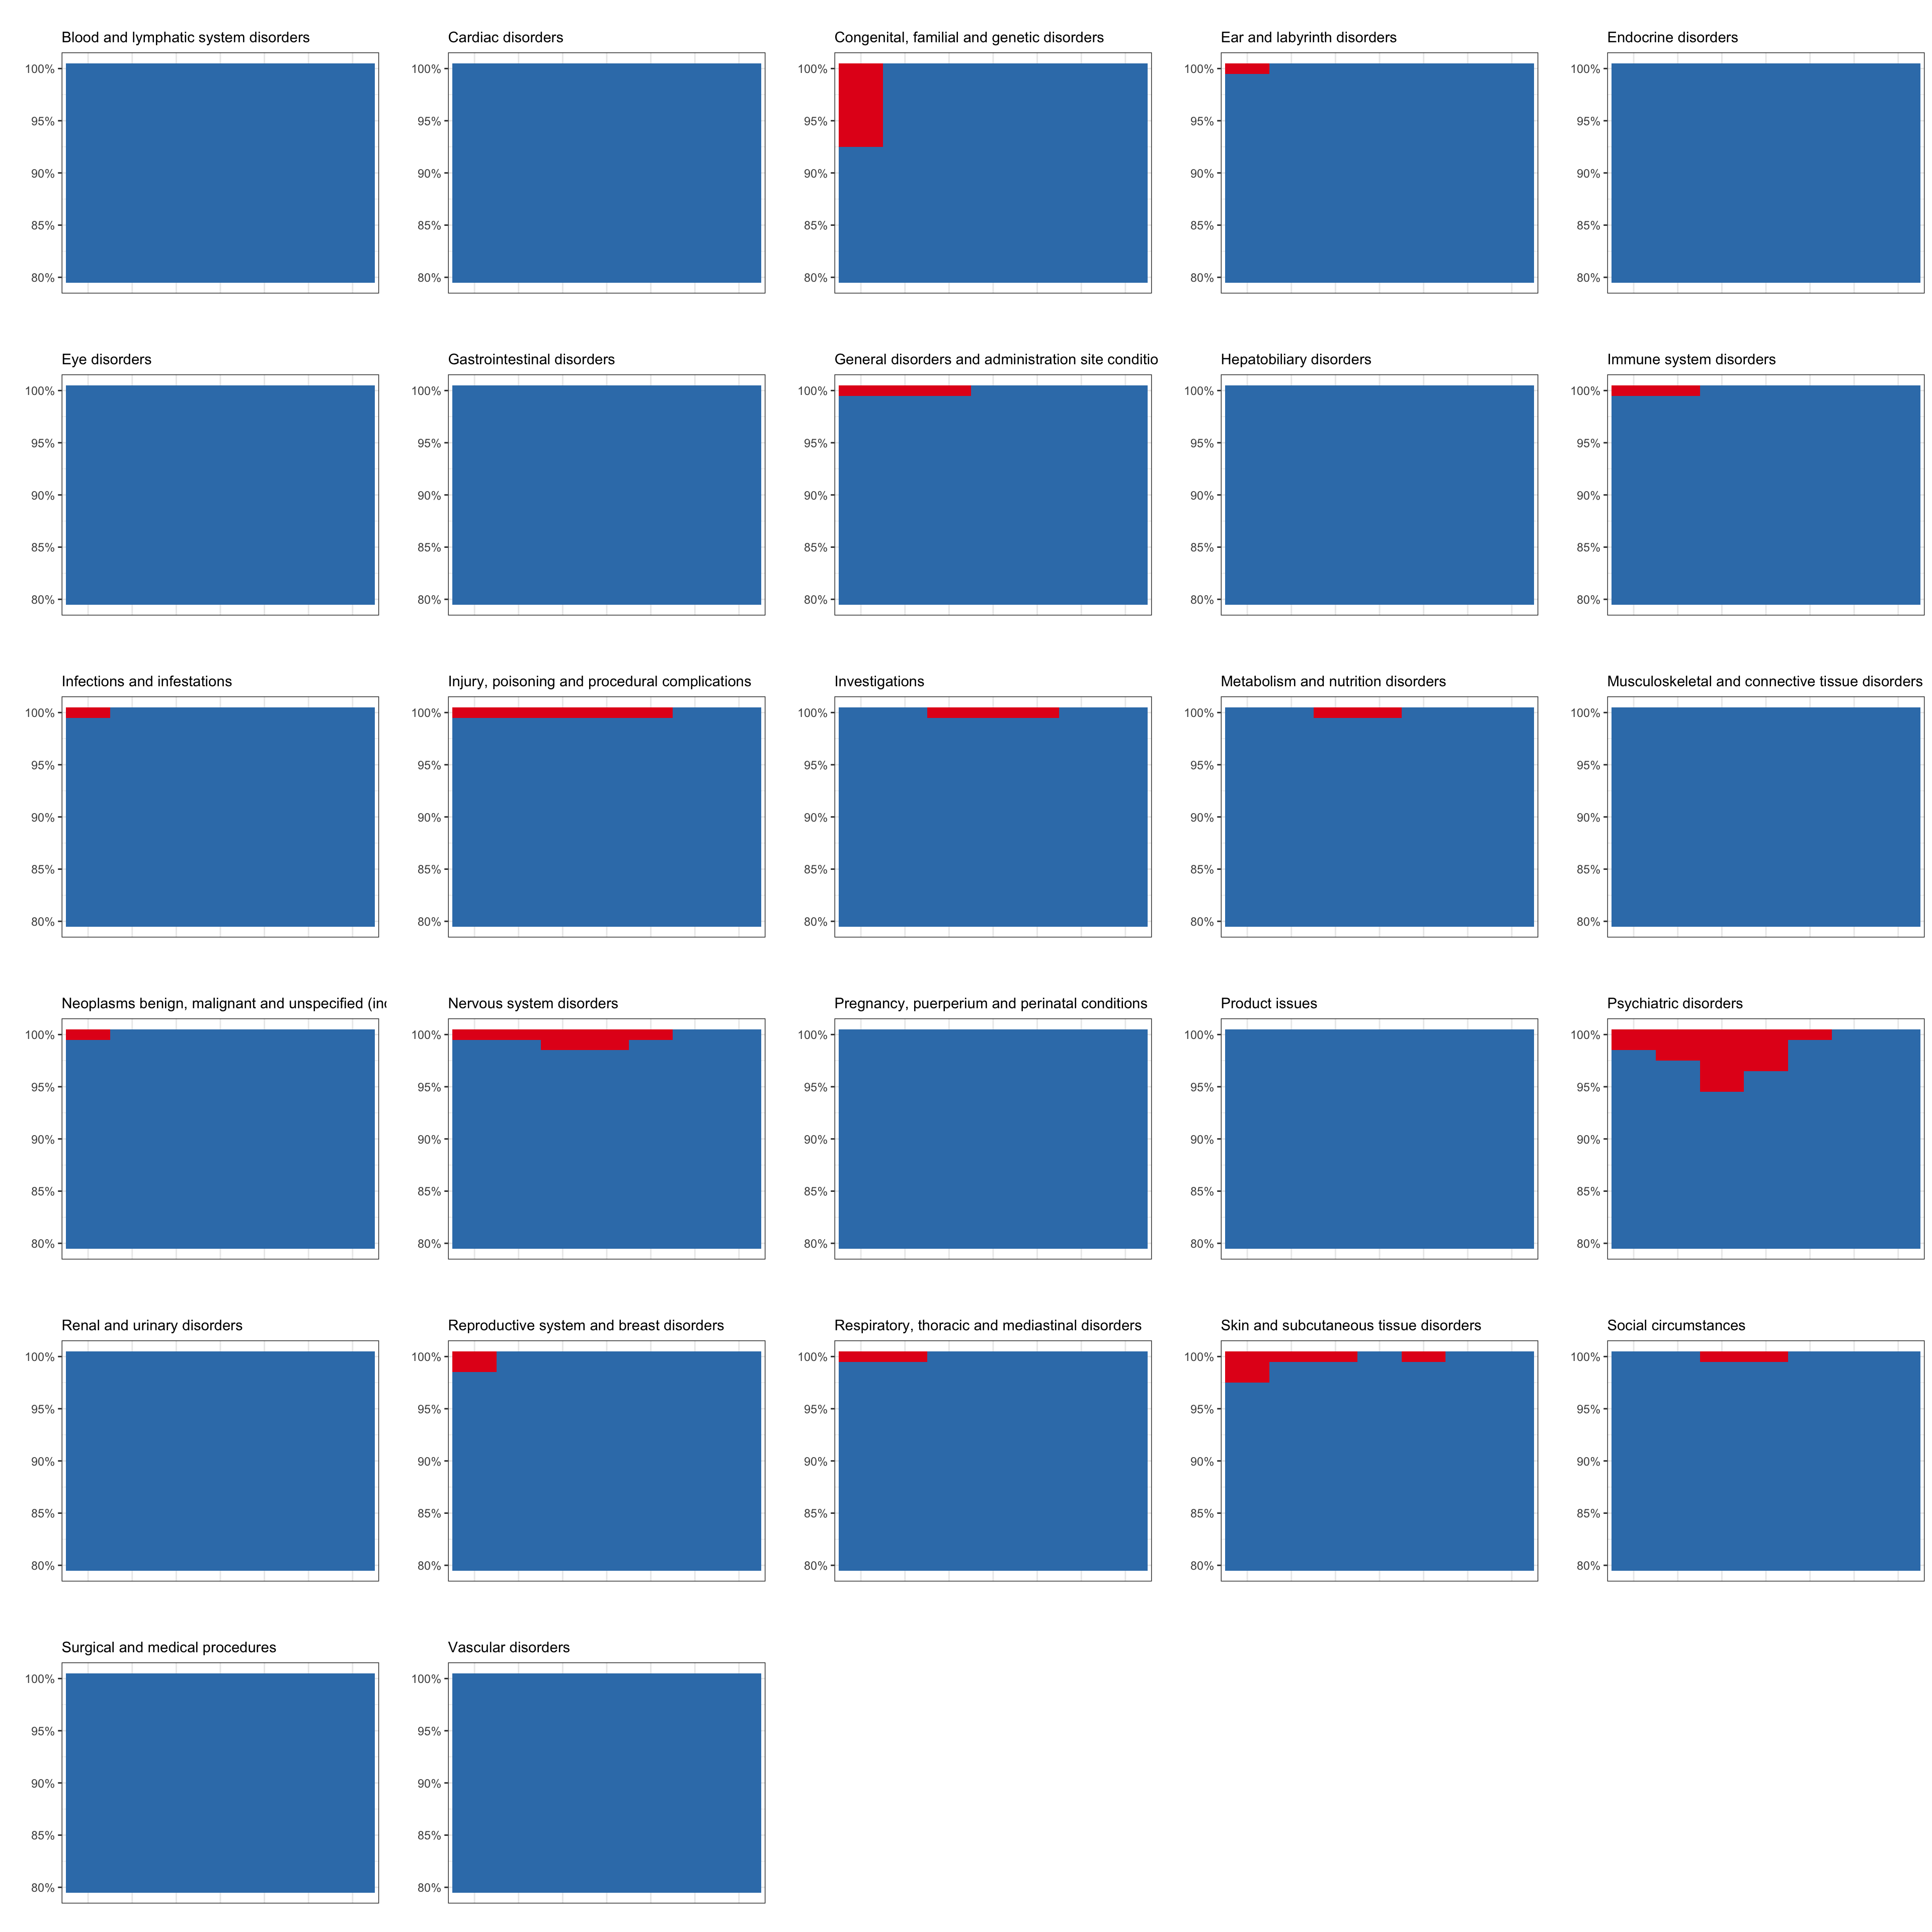
Since the last graph is the most definitive graph showing localization of non-random signal for this systematic disorder, we can create the graph for all montelukast-induced systematic disorders in order to evaluate non-random signal at stages:

disorders <- 
    tbl(con,"event") %>%
    collect() %>% 
    pull(meddra_concept_name_4) %>% 
    na.omit() %>% 
    unique()

pos <- 
    position_dodge2(width=0.1)
probs <- seq(0.8,1,0.01)
colors <- RColorBrewer::brewer.pal(3,"Set1")[1:2]
names(colors) <- c("TRUE","FALSE")

g_objs <- lapply(disorders,function(disorder){
    disorder_ids <- 
    tbl(con,"event") %>%
    collect() %>%
    filter(meddra_concept_name_4==disorder) %>%
    pluck('meddra_concept_id')
    
    tbl(con,"ade_nichd") %>% 
    filter(atc_concept_id==!!pluck(montelukast_drug_info,"atc_concept_id") &
               meddra_concept_id %in% !!disorder_ids) %>% 
    collect() %>% 
    mutate(
        nichd = factor(nichd,levels=unique(nichd))
    ) %>% 
    group_by(nichd) %>% 
    summarise(q = list(probs),
              qs = 
                  list(quantile(gam_score_90mse,probs = probs))
              ) %>% 
    unnest(c("qs","q")) %>% 
    left_join(
        tbl(con,"ade_null") %>% 
            collect(),
        by="nichd"
    ) %>% 
    mutate(
        nichd = factor(nichd,levels=unique(nichd)),
        above_null_99 = qs>null_99
    ) %>% 
    ggplot(aes(nichd,q,fill=above_null_99)) +
    geom_tile(show.legend = F) +
    scale_y_continuous(labels = scales::percent,
                       breaks = scales::pretty_breaks(6)) +
    scale_fill_manual(values=colors) +
    labs(y="",x="",title="",subtitle=disorder) +
    theme(
        axis.text.x = element_blank(),
        axis.ticks.x = element_blank()
    )
})

names(g_objs) <- disorders

cowplot::plot_grid(plotlist=g_objs,ncol = 5)

You can see that few systematic disorders had higher-than-the-null signal at stages. Psychiatric disorders do seem to be uniquely induced in toddlers by montelukast.

kidsides::disconnect_sqlite_db(con)