library(ggplot2)
library(dplyr)
library(Hmisc)
Hmisc::getRs('reptools.r')Announcing the kidsides R package
We hypothesized that adverse drug reactions manifest from the interaction between drug exposure and dynamic biological processes during child growth and development. The {kidsides} R data package contains half a million drug safety hypotheses.
One of the main research questions during my PhD was how does the biology of childhood interact with medications taken during by children? After years of research and reading the literature my thesis became:
Adverse drug reactions manifest from the interaction between drug exposure and dynamic biological processes during child growth and development.
To investigate, we generated thousands of statistical signals of the interaction between pediatric population drug reporting and the child development stage resulting in an adverse event1. For more details the reference is freely available at this reference1.
The statistical model we used was a generalized additive model with this basic specification
g(E(Adverse reaction)) = spline(stage, by = Drug)The {kidsides} R data package makes this database more accessible by caching the SQLite database on your machine. You can read up more regarding installation at the website https://kidsides.nickg.bio. Additionally, there is an overview on the data within the database at this vignette, and a tutorial on extracting smaller, more manageable datasets in this vignette.
Fair warning, R 4.0 and above is required; and the entire database is almost 1 GB
Your main questions about {kidsides} may be what data do the tables have and what kind of graphics could I make? In this post, I want to
- Give a preview of all 17 tables in the SQLite database.
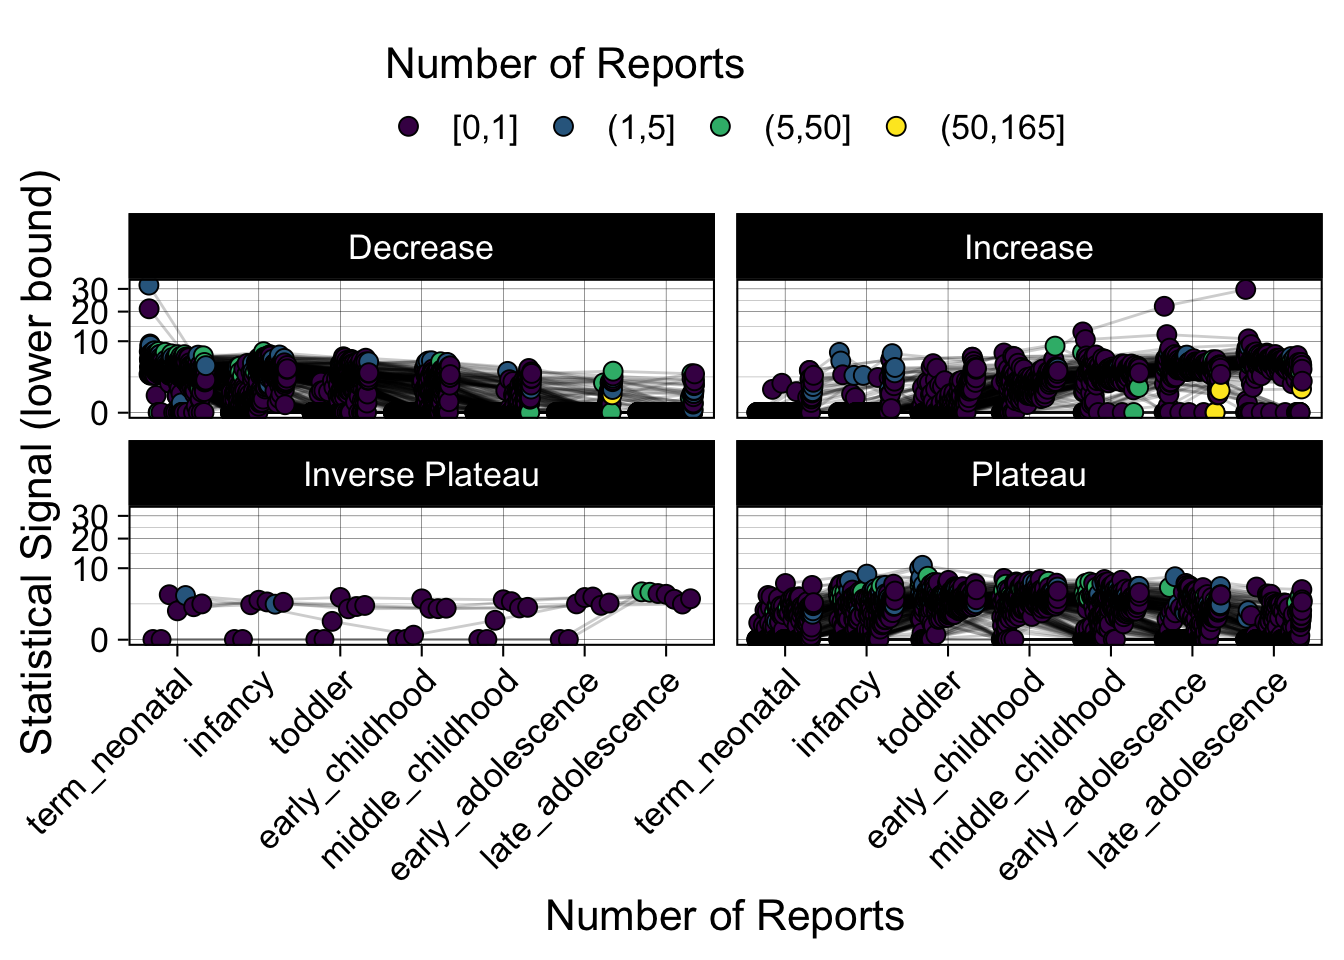
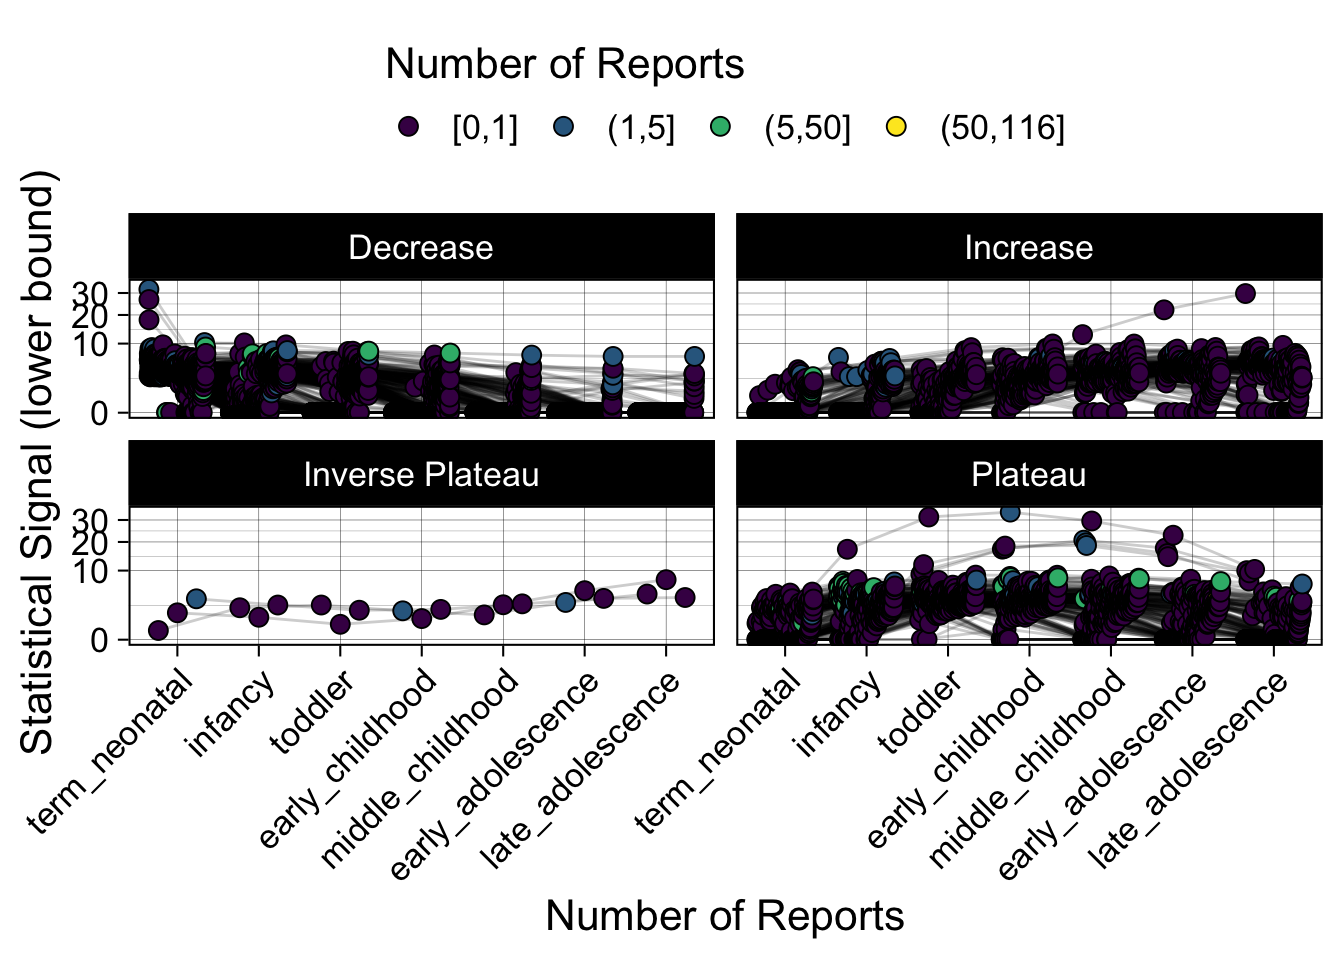
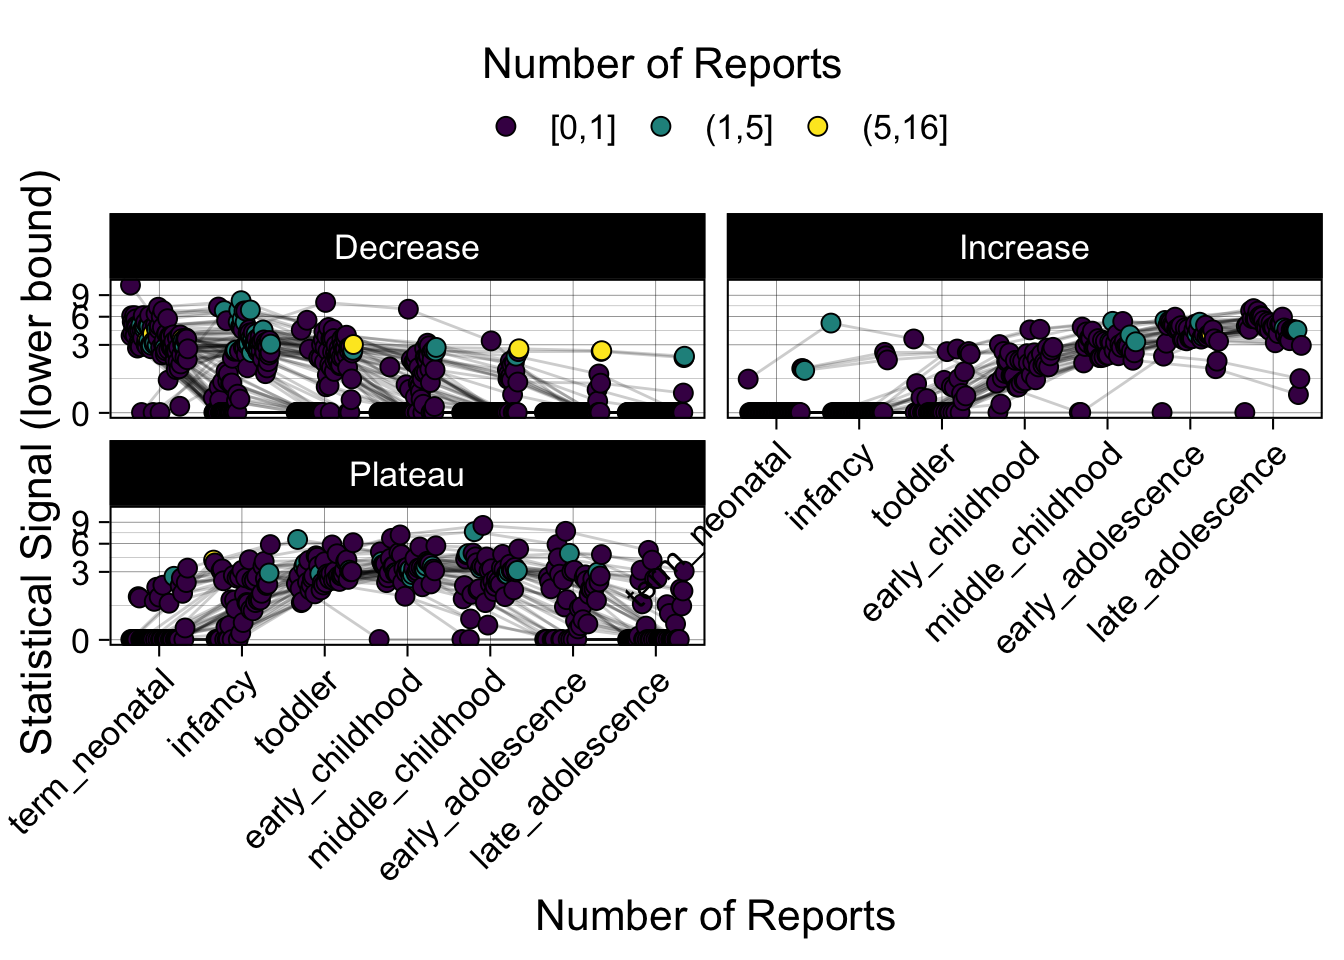
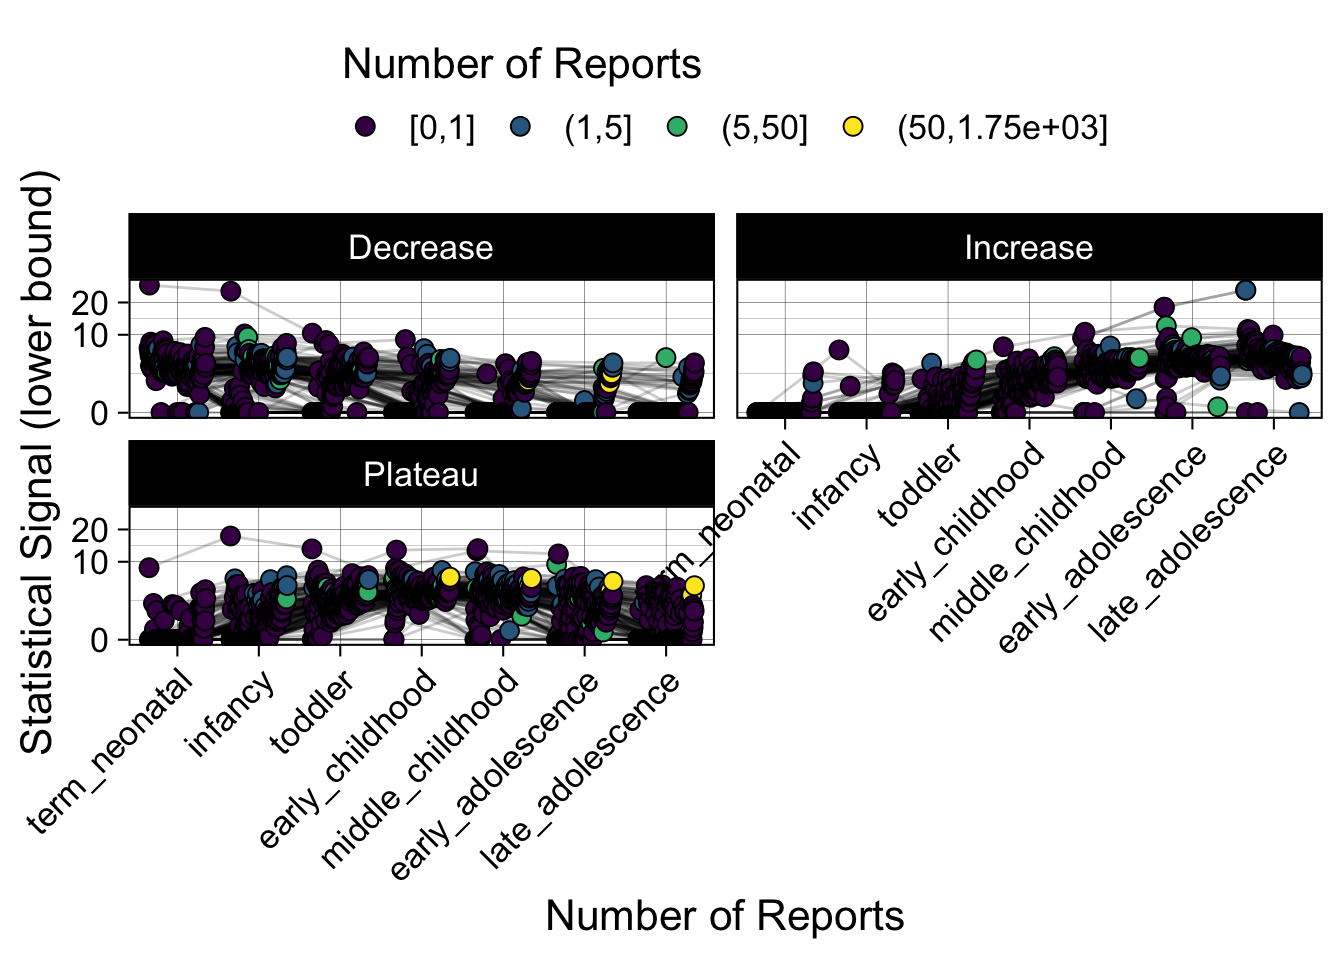
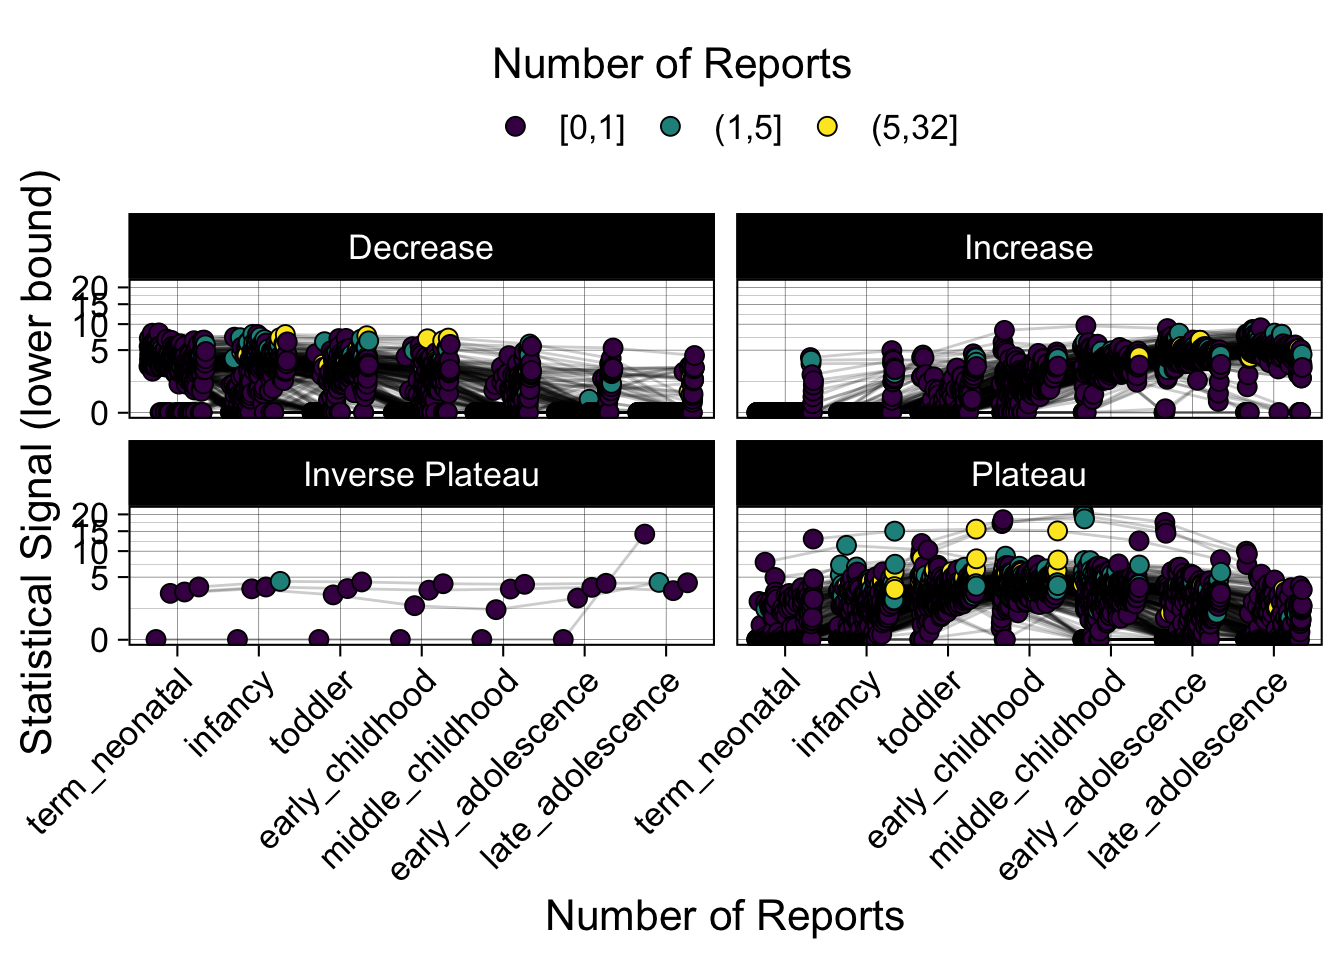
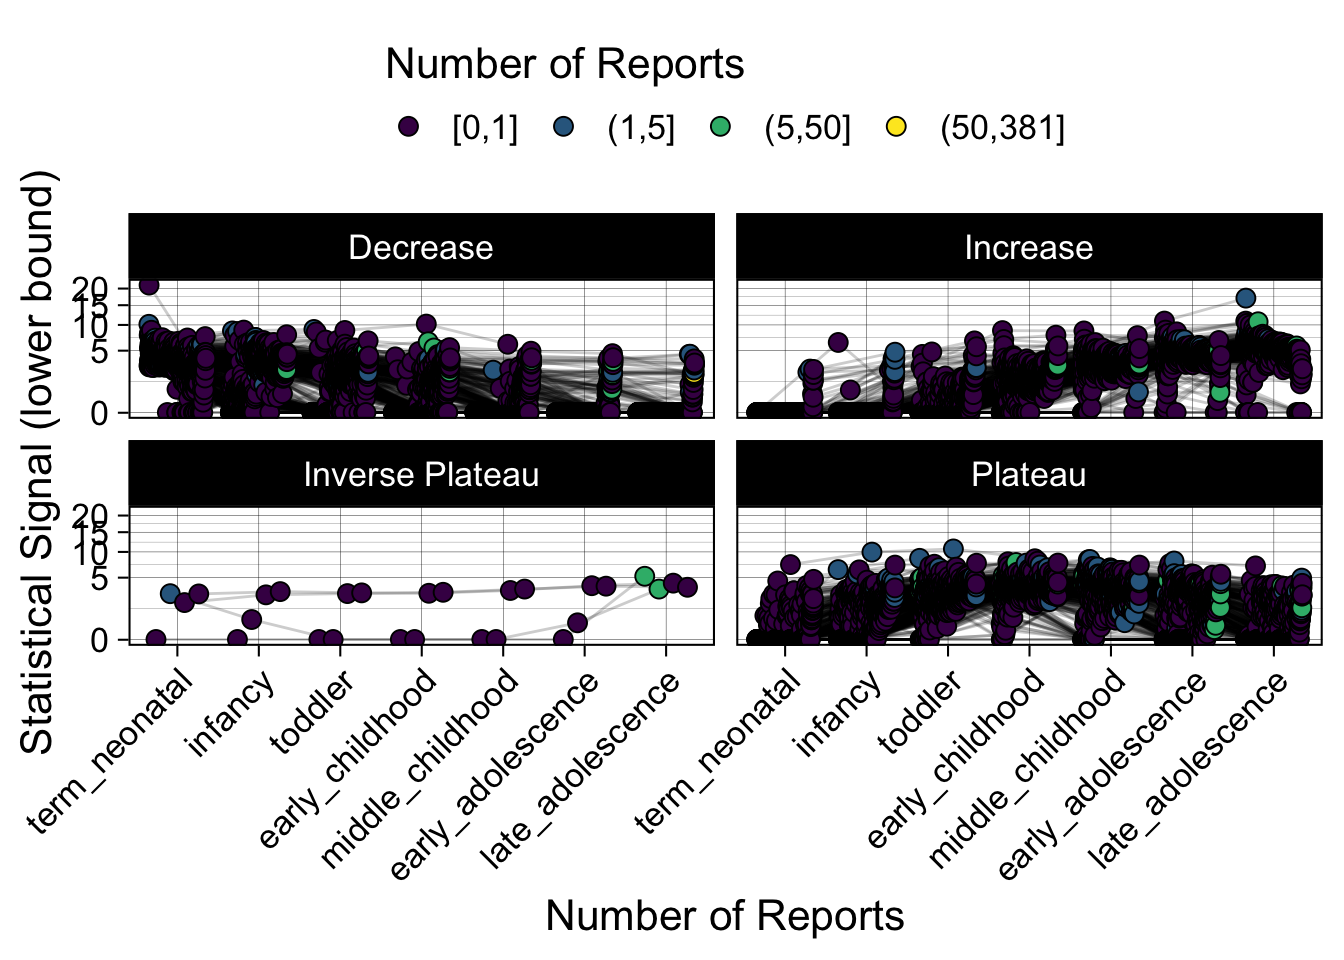
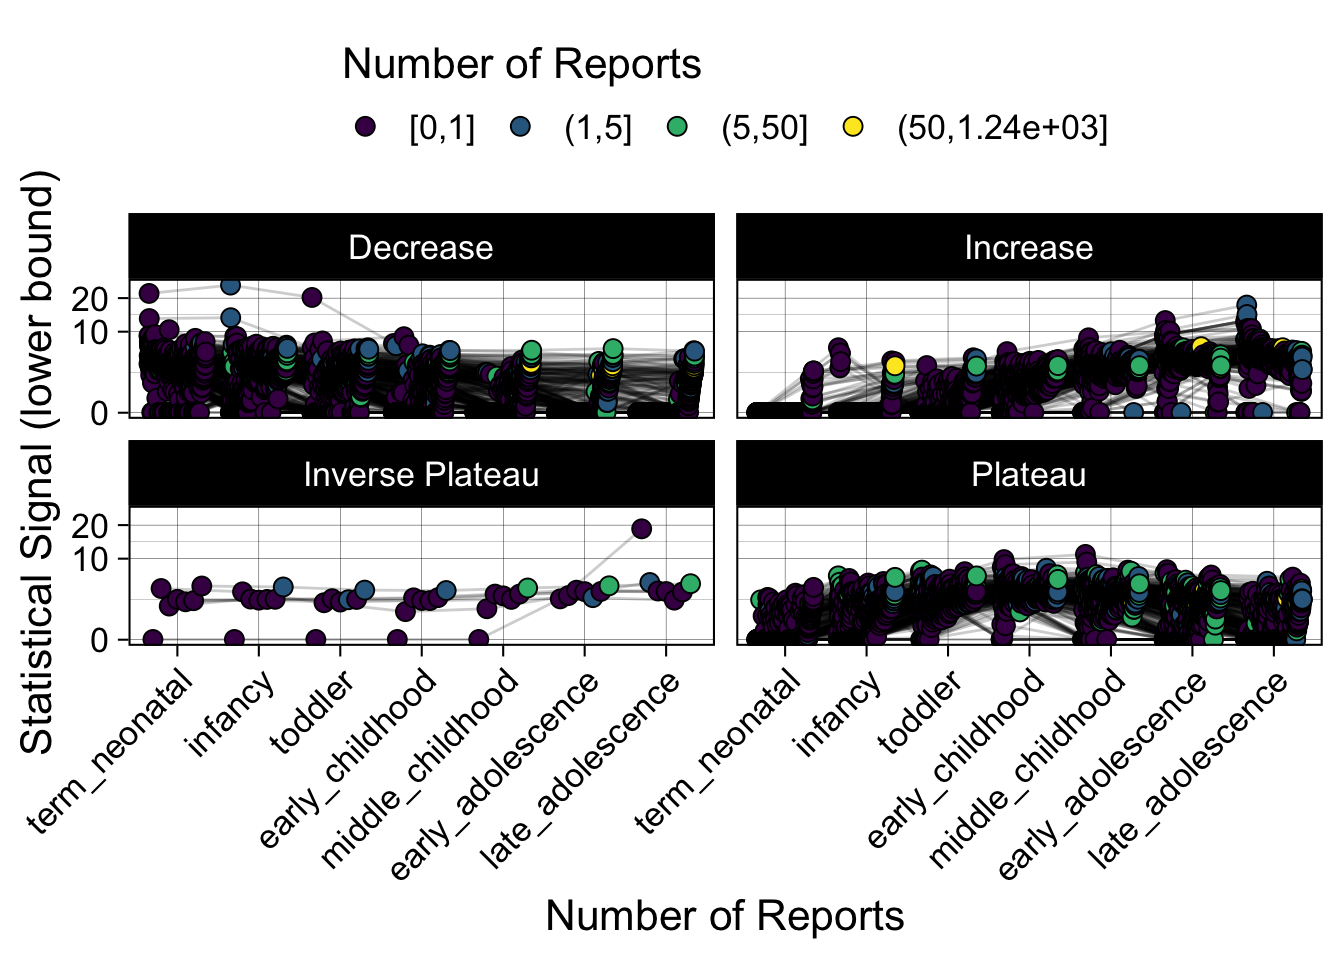
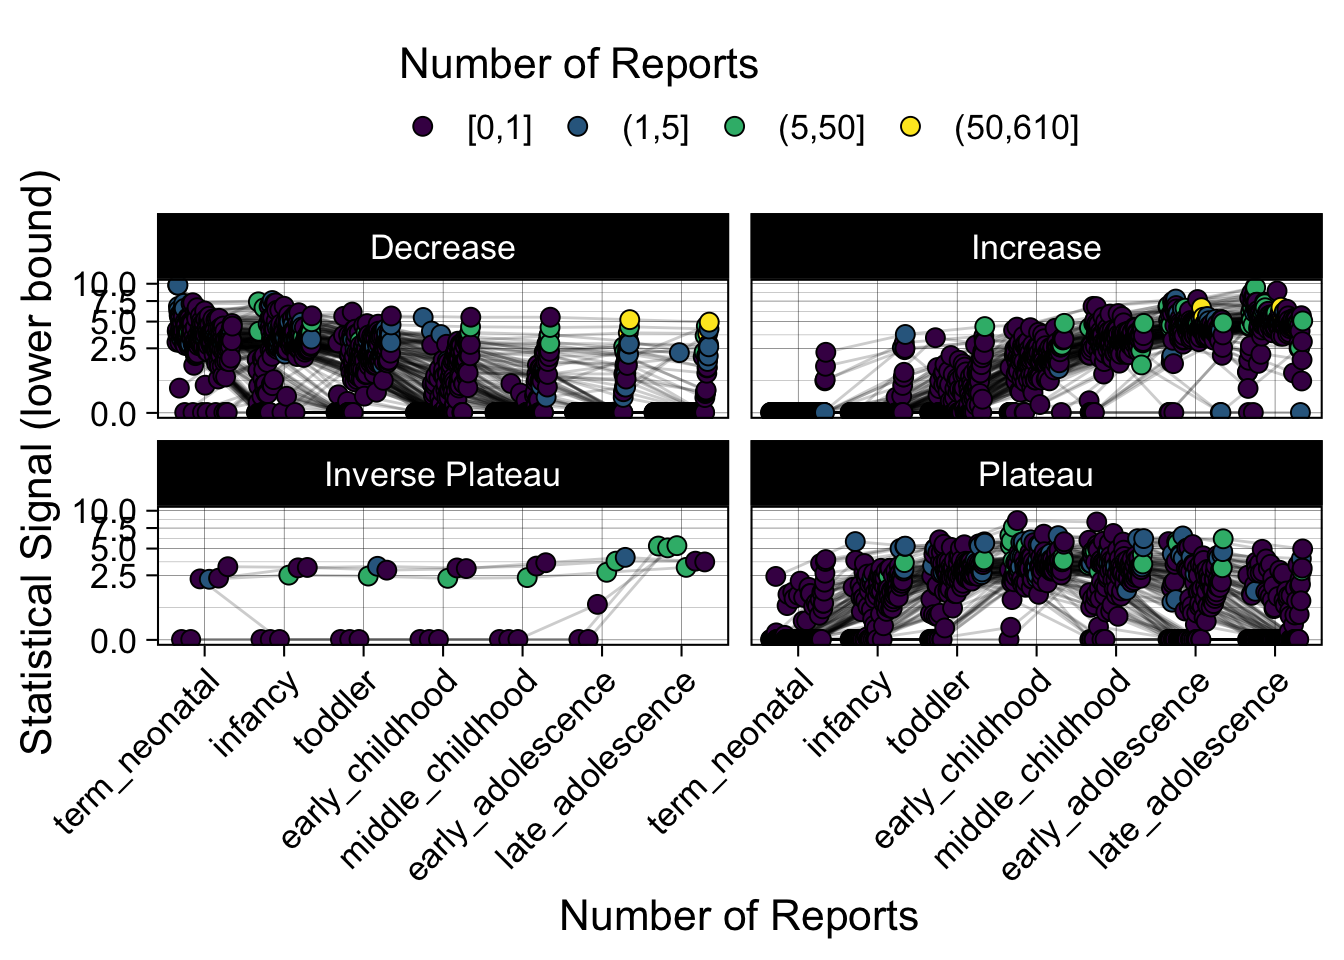
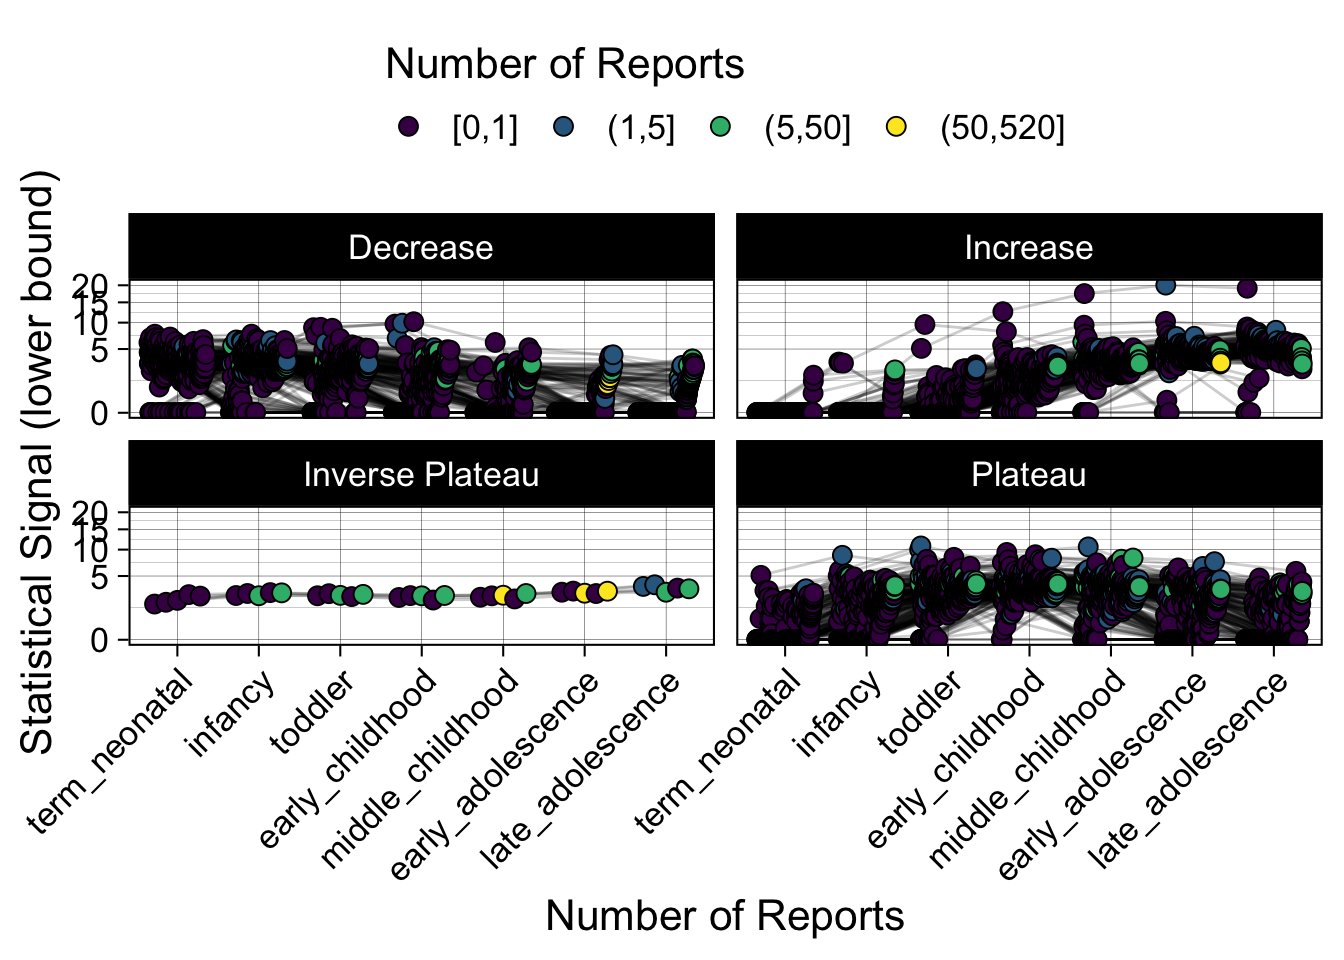
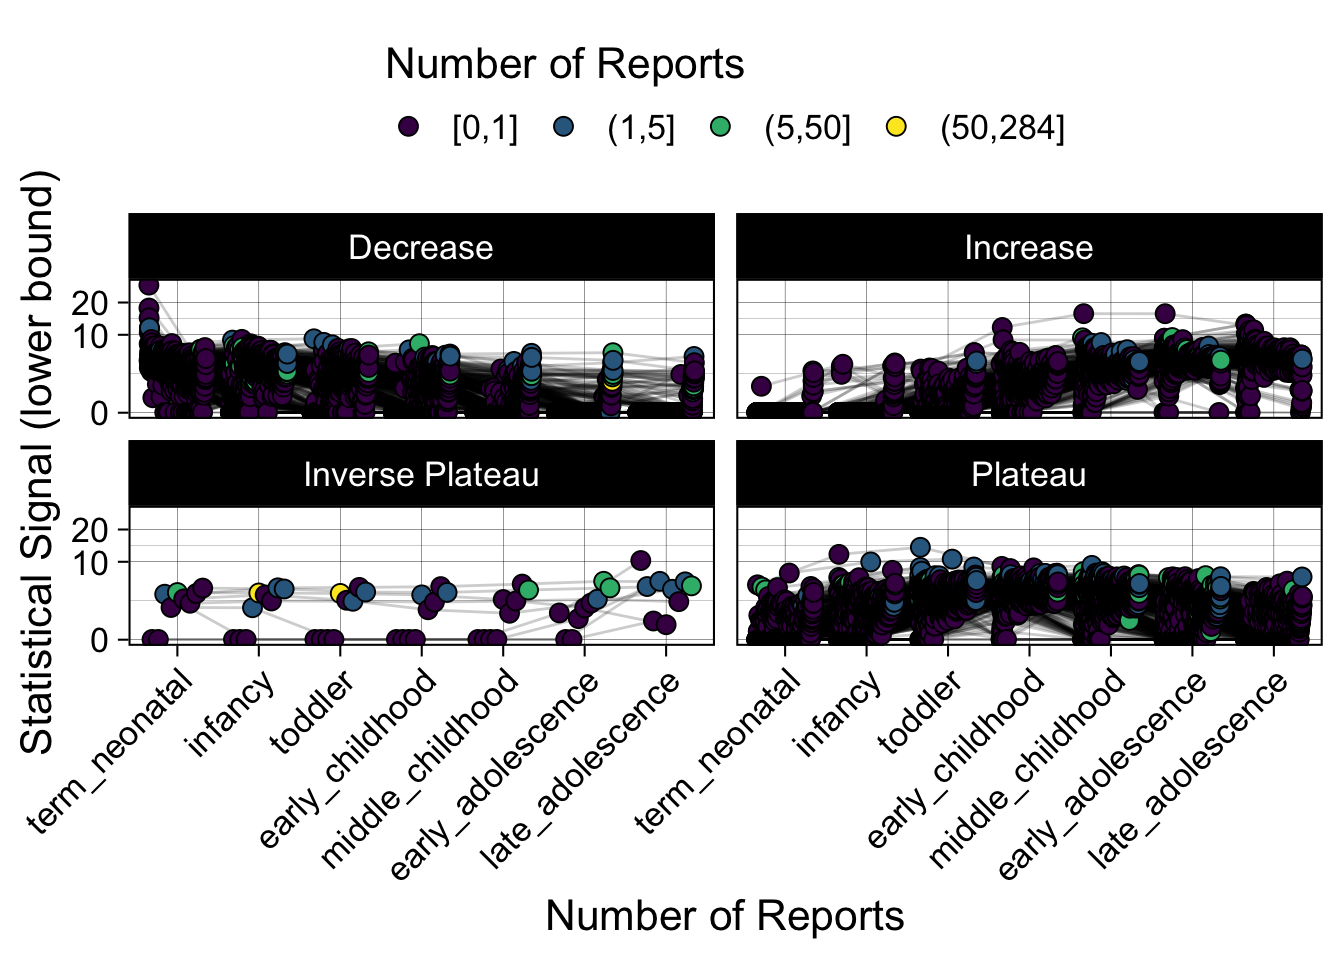
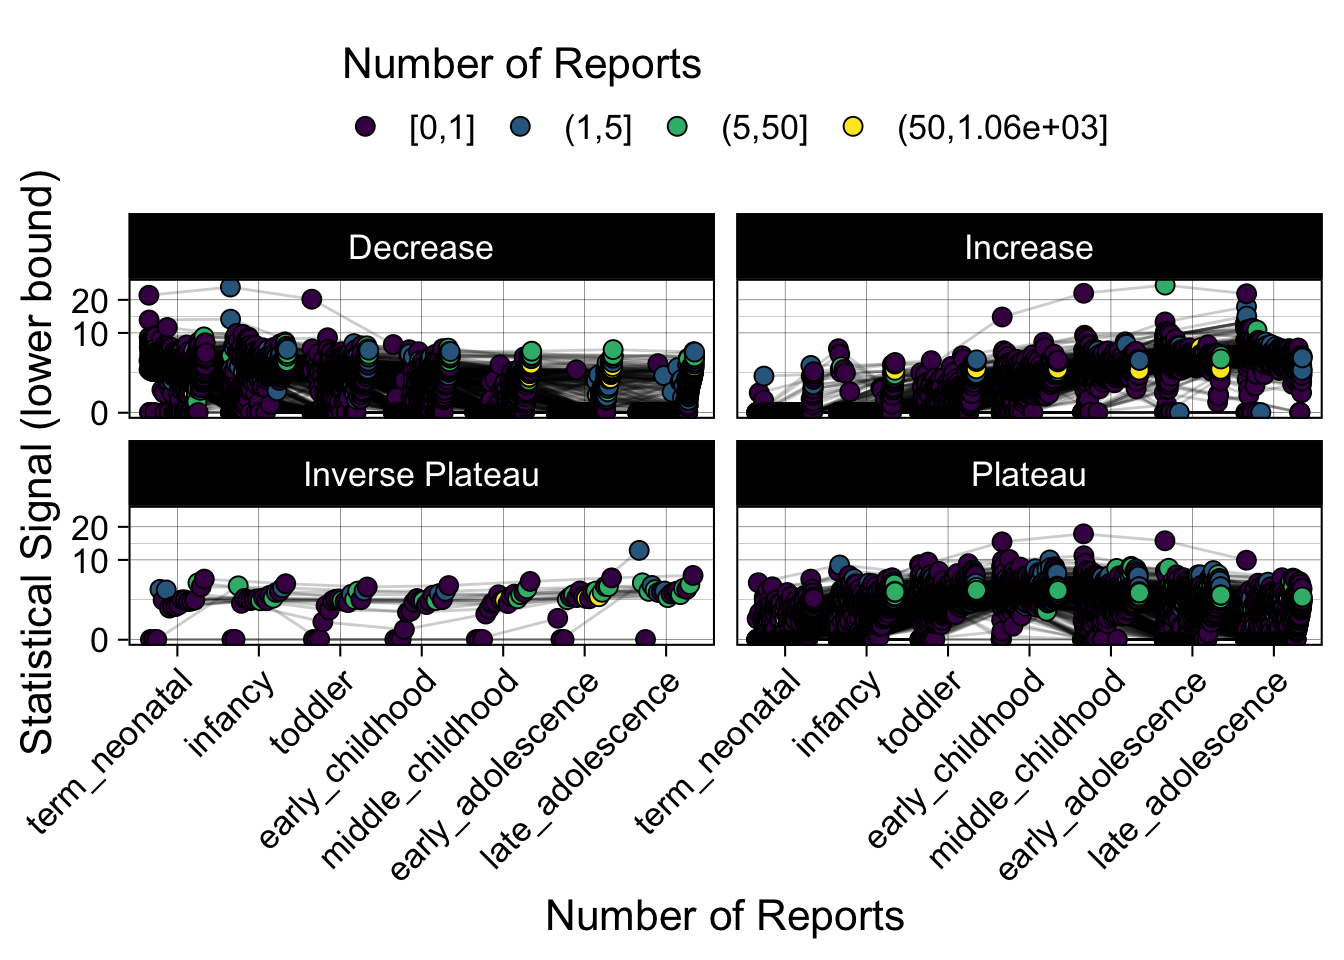
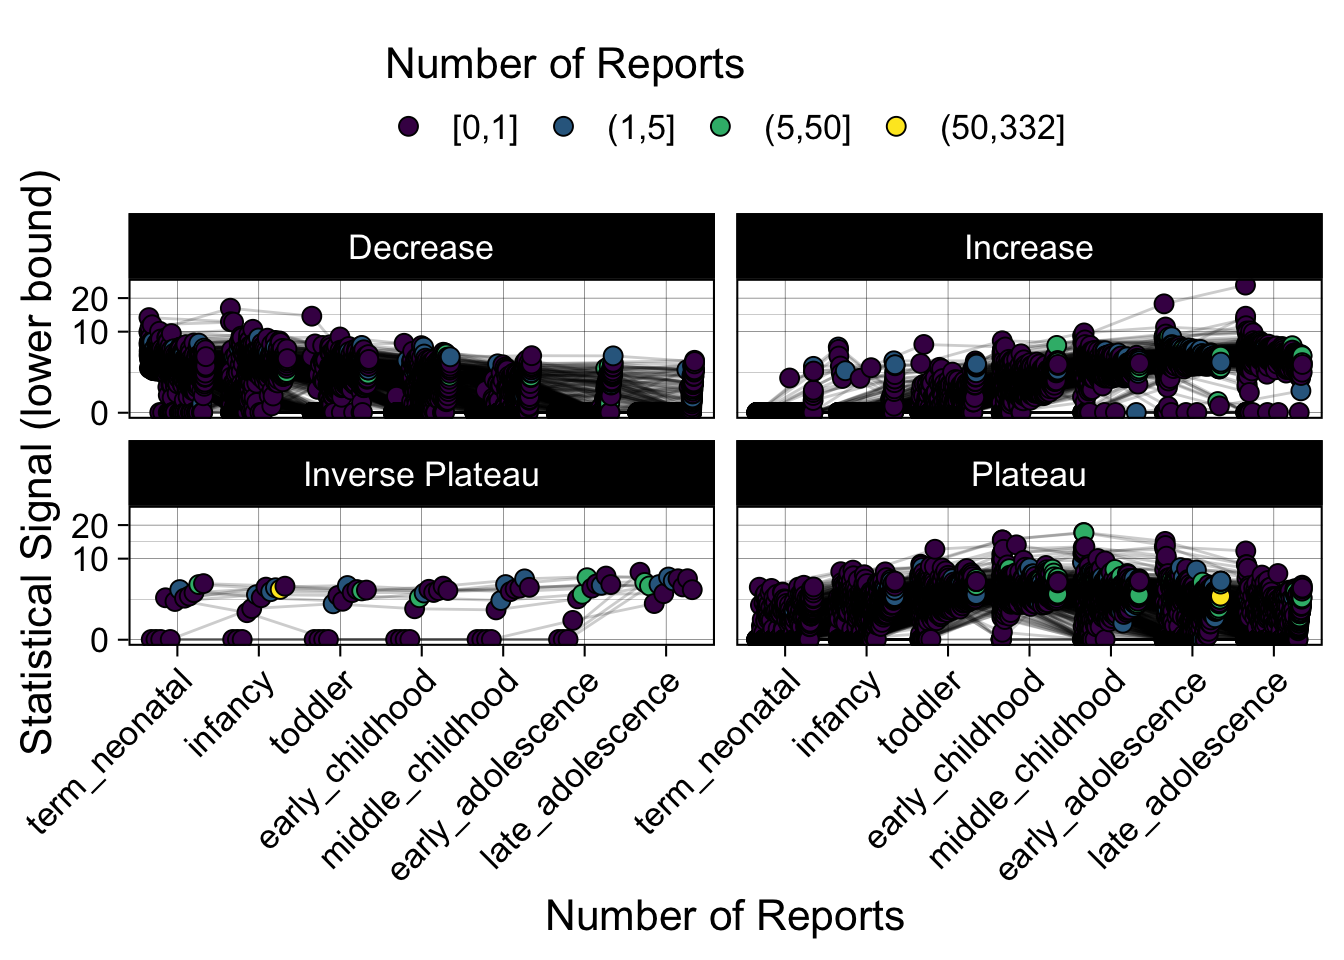
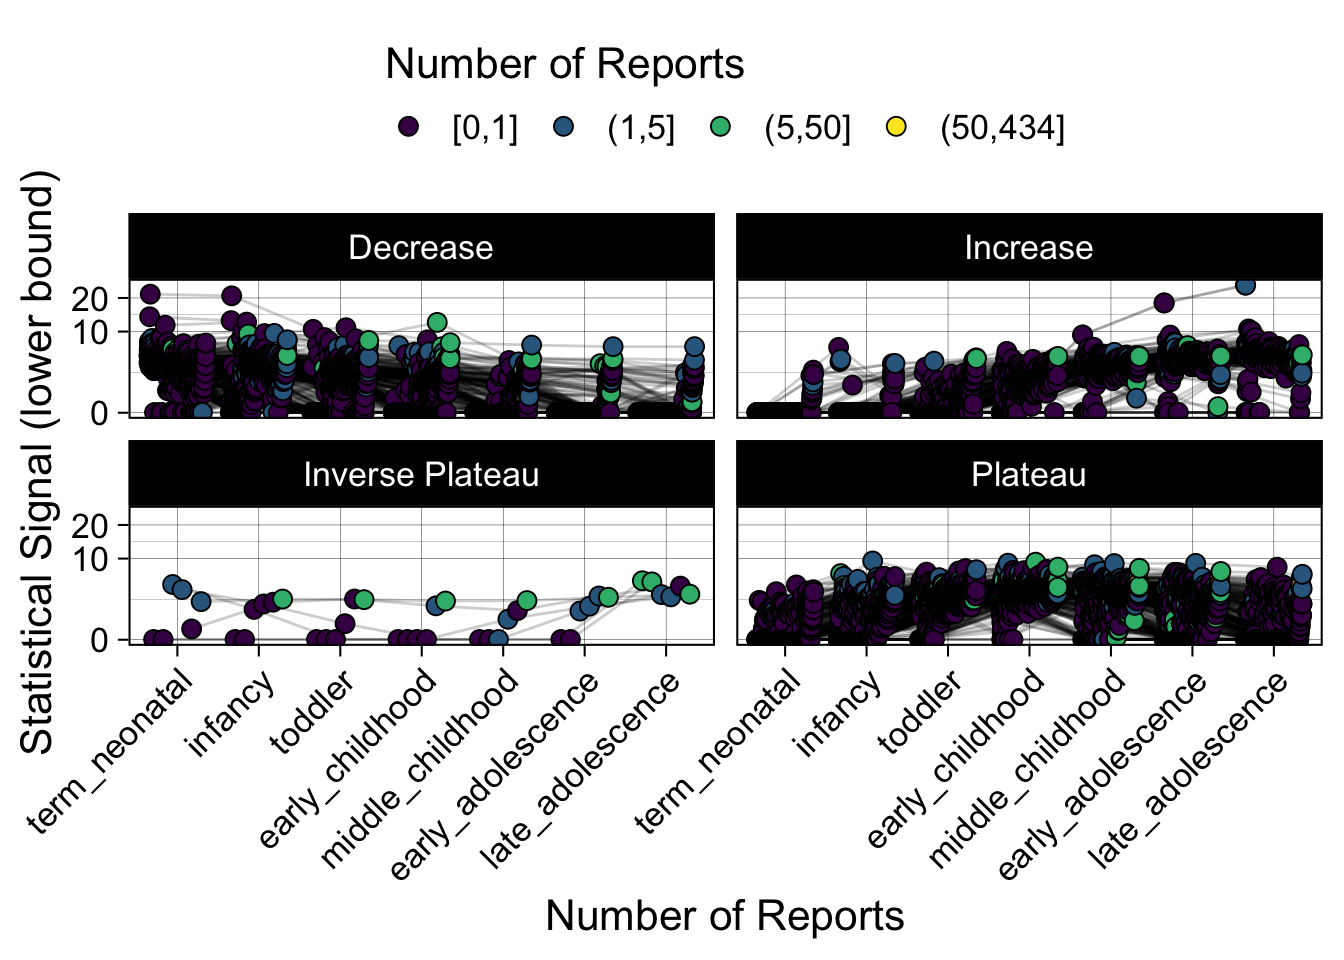
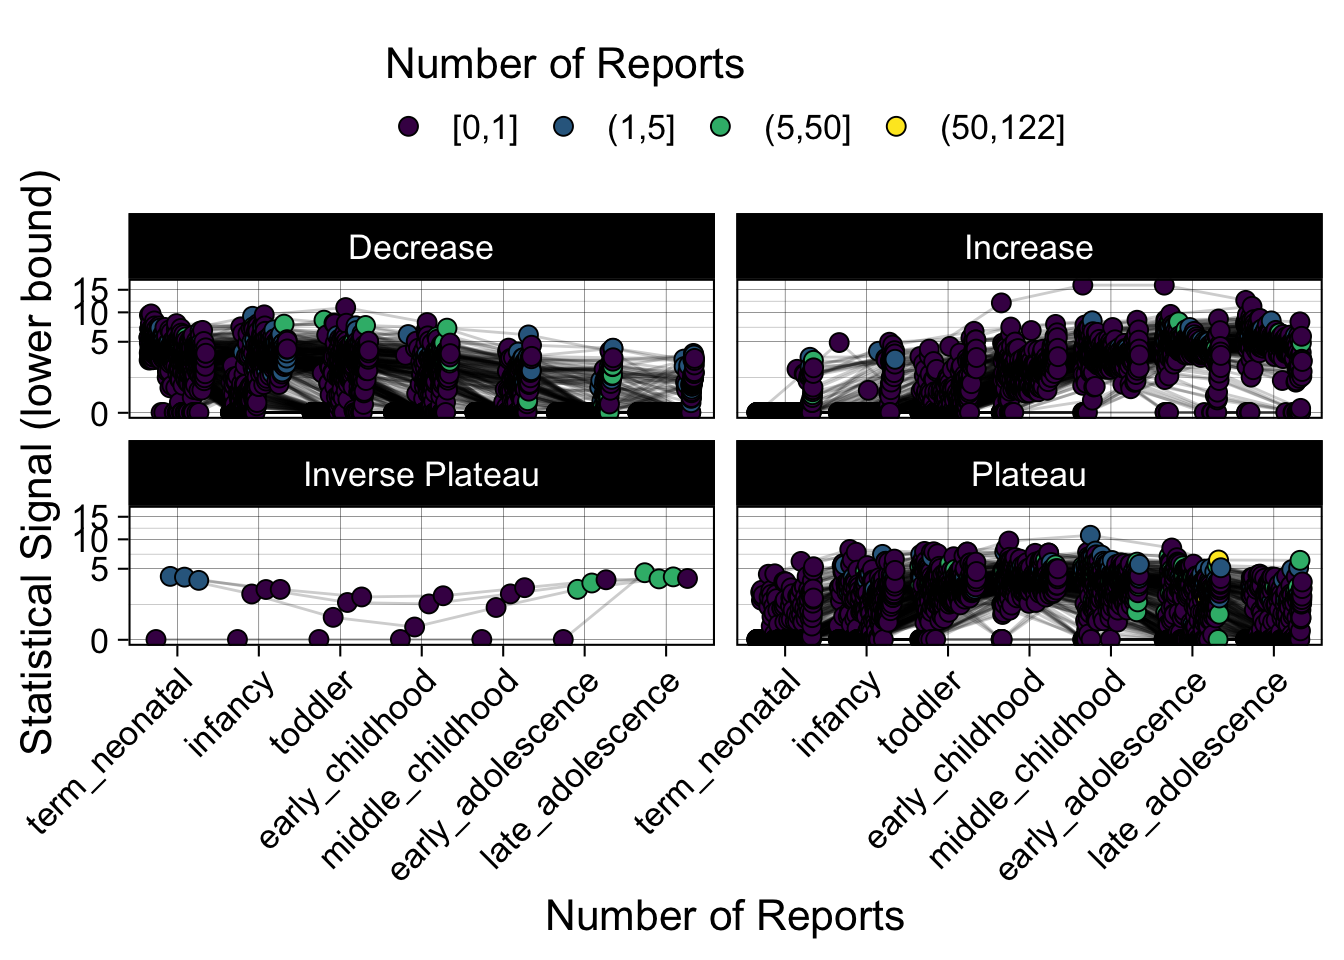
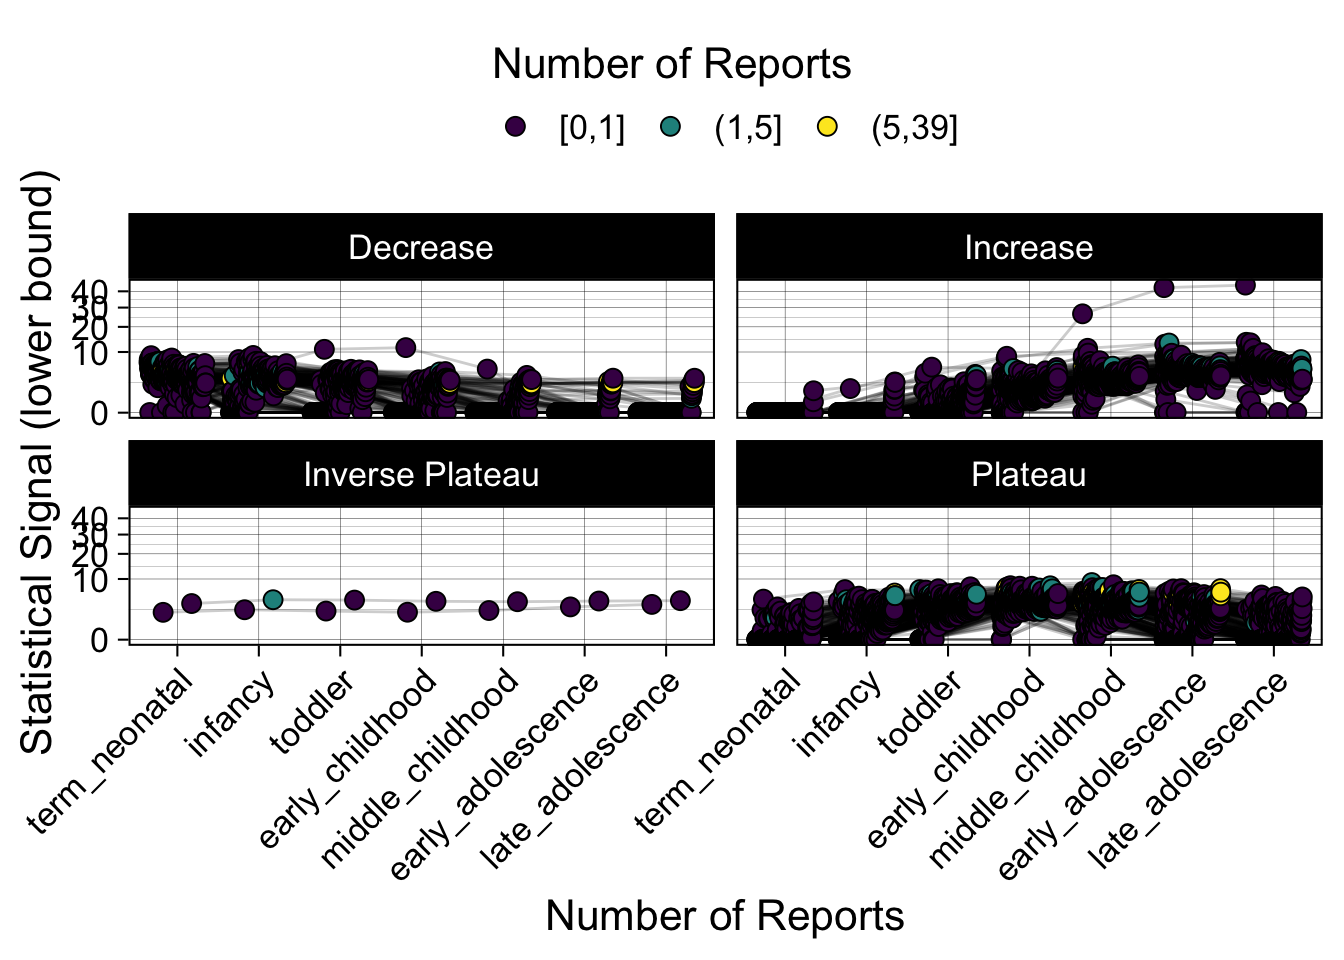
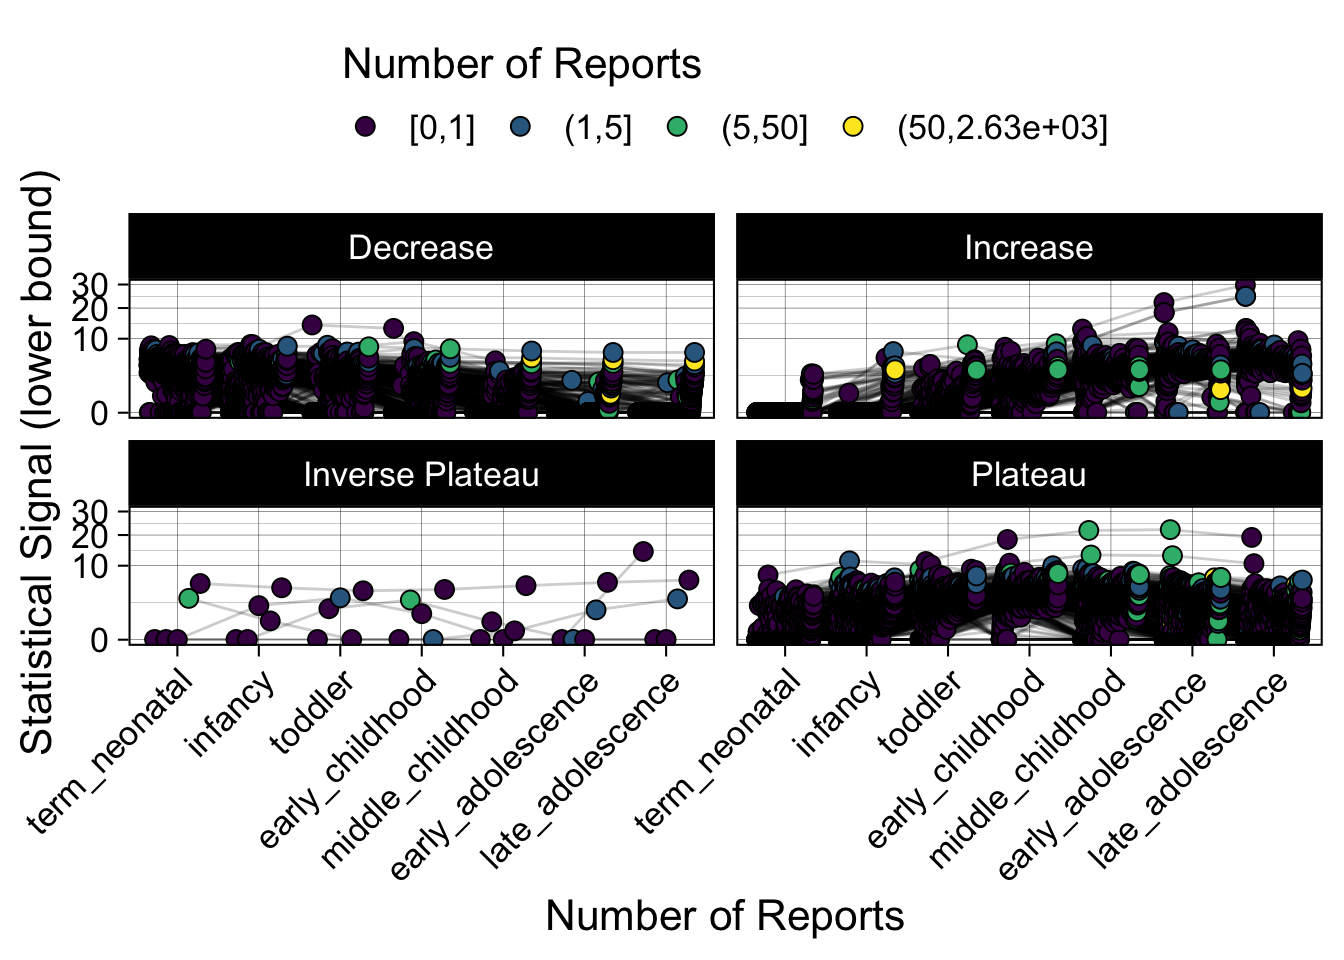
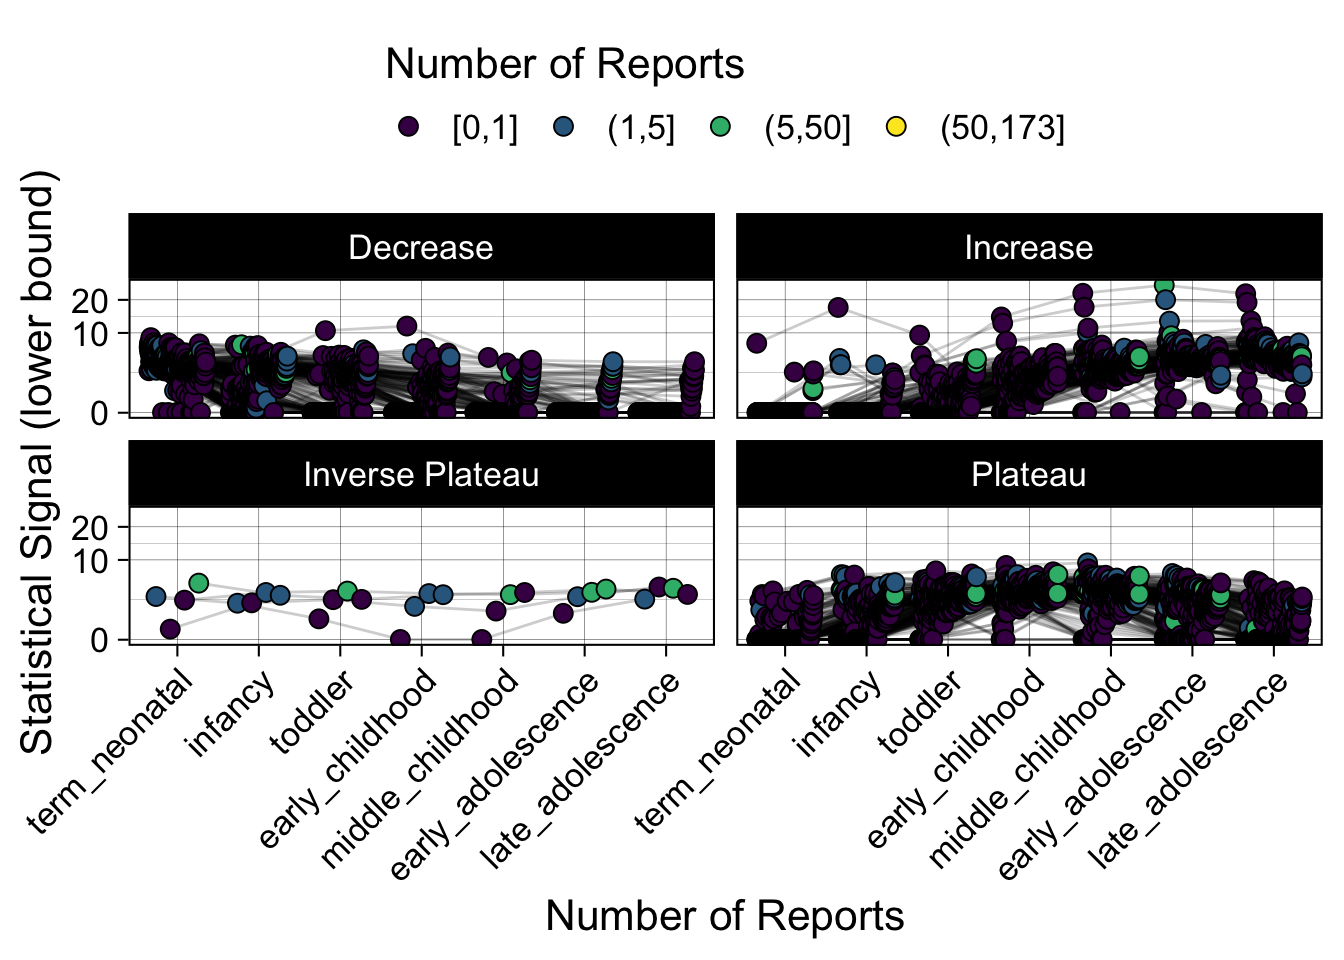
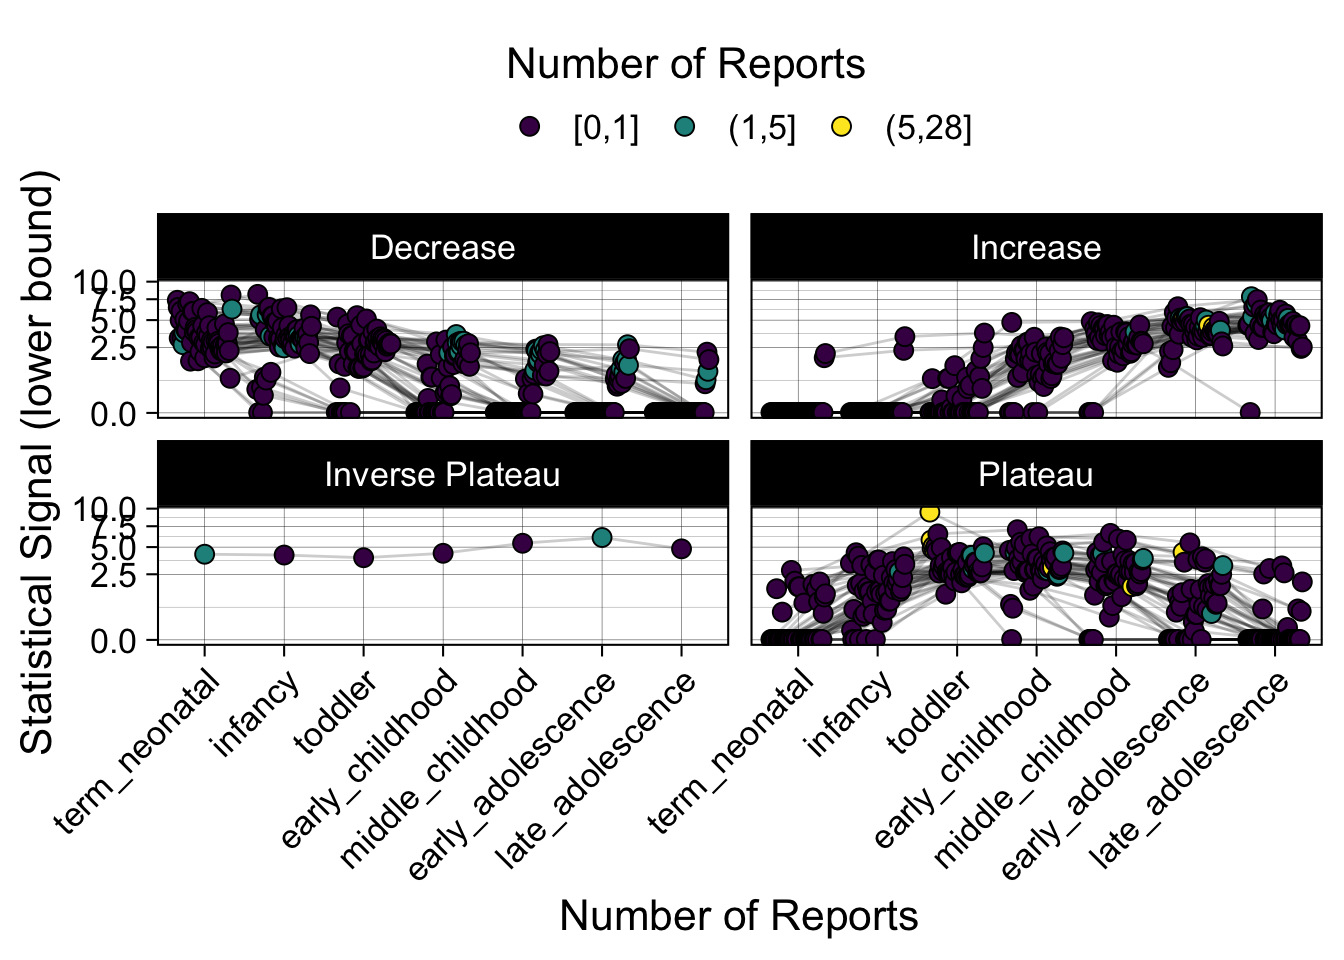
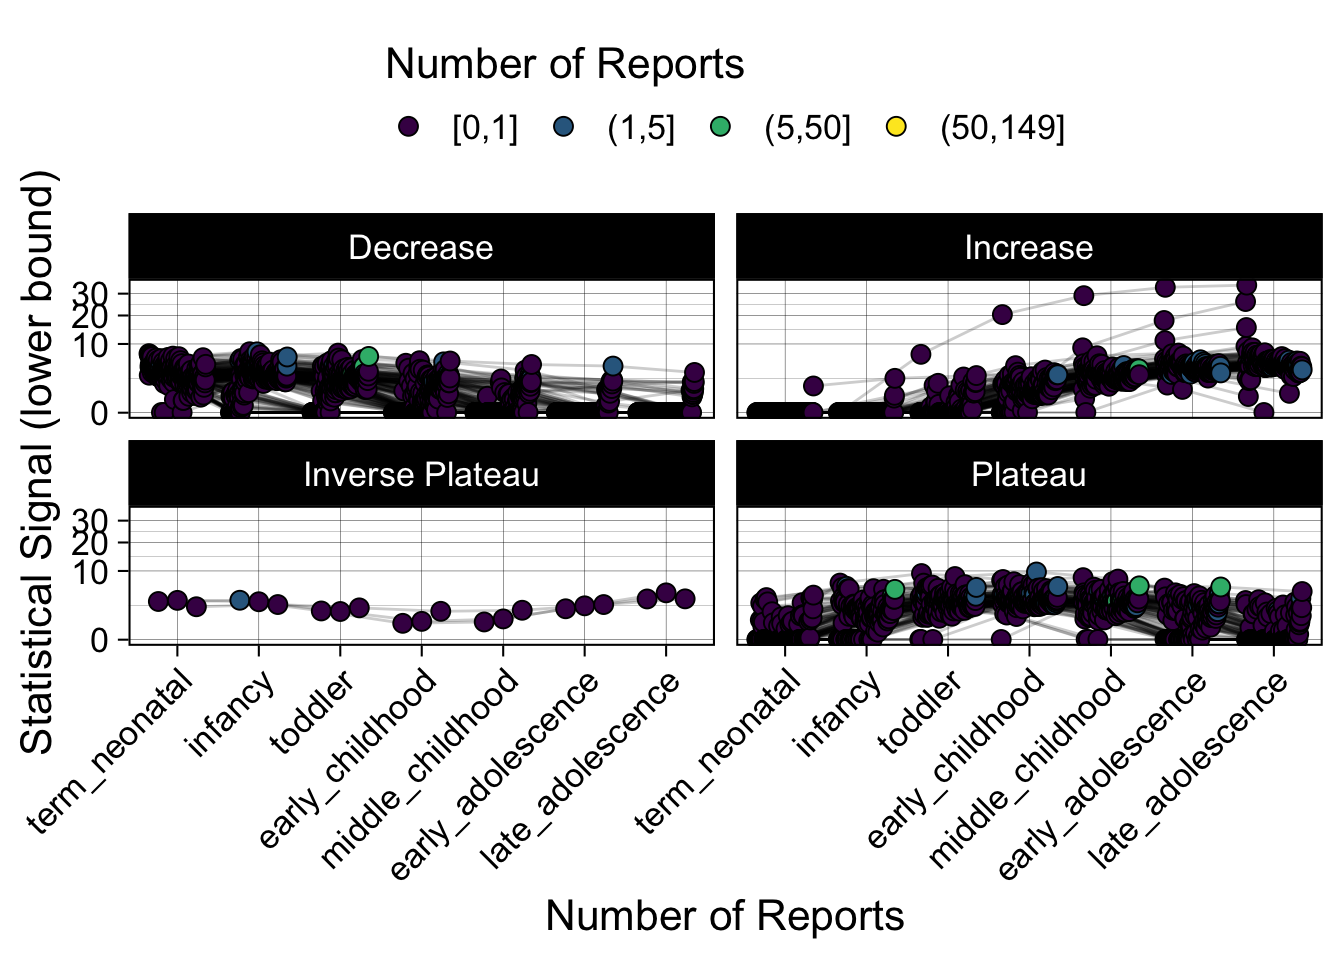
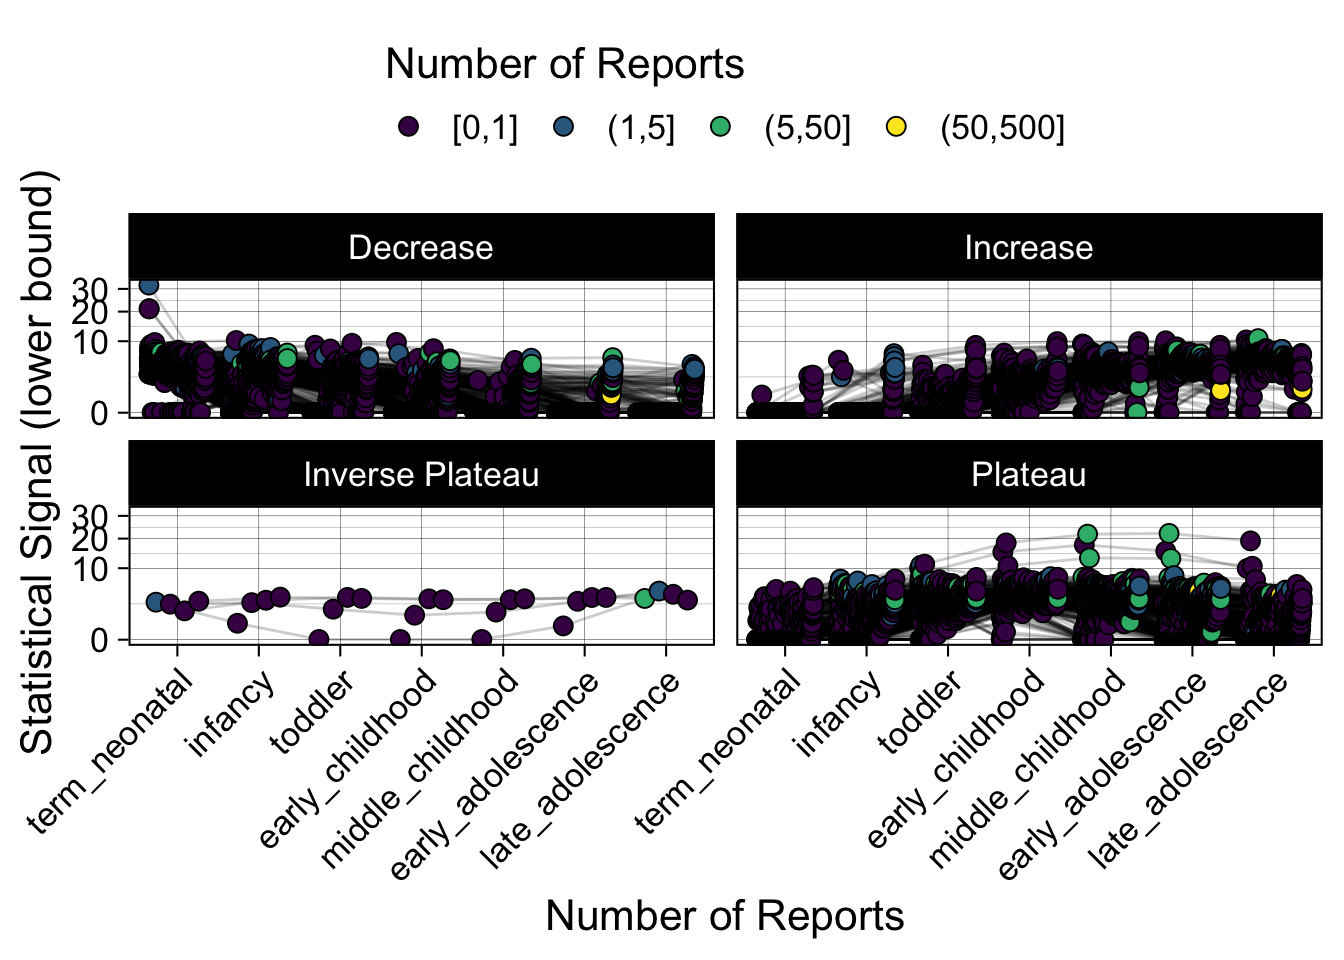
- Show how the strength of the hypothesized interactions depending on the class of a medication, such as cardiovascular or psychiatric drug class. Interaction investigated here: Number of reports for an adverse drug event vs. Estimated drug safety signal.
I will make use of Frank Harrell’s reptools R code that will make individual tabs in this document for each table/graph below.
There are only 3 functions that come with {kidsides}. Once {kidsides} is installed from CRAN, you can easily cache the database with the following command:
`install.packages(‘kidsides’)
kidsides::download_sqlite_db()The cache location is determined by the {tools} package. Using the other two functions in {kidsides}, you can easily connect and disconnect from the database, respectively.
Now, onto the showcases!
con <- kidsides::connect_sqlite_db()tables <- DBI::dbListTables(con)
items <- purrr::map(tables,~{
DT::datatable(tbl(con,.x) %>%
head(100) %>%
collect(),
options = list(dom = 'tf',
pageLength=5,
scrollX = TRUE,
deferRender = TRUE,
scrollY = 500,
scroller = TRUE),
extensions = 'Scroller')
})
names(items) <- tables
maketabs(items)soc_categories <- tbl(con,'event') %>%
select(meddra_concept_name_4) %>%
distinct() %>%
collect() %>%
na.omit() %>%
pull()
items <- purrr::map(soc_categories,~{
soc_events <-
tbl(con,'event') %>%
filter(meddra_concept_name_4==.x) %>%
select(meddra_concept_id) %>%
distinct() %>%
collect() %>% pull() %>% na.omit()
soc_ades <- tbl(con,'ade') %>%
filter(meddra_concept_id %in% soc_events &
gt_null_99) %>%
select(ade) %>%
distinct() %>%
collect() %>% pull() %>% na.omit()
tmp <- tbl(con,'ade_nichd') %>%
filter(ade %in% soc_ades) %>%
select(ade,nichd,gam_score_90mse,DE) %>% collect()
eps <- 0.0001
ades_ordered <-
arrange(tmp,gam_score_90mse) %>%
slice(1,.by=ade) %>% pull(ade) %>% factor()
ade_cluster_map <-
tbl(con,'ade') %>%
select(ade,cluster_name) %>%
filter(ade %in% soc_ades) %>%
collect()
plot_tmp <-
tmp %>%
left_join(ade_cluster_map,by='ade') %>%
mutate(
ade = factor(ade,levels=ades_ordered),
nichd = factor(nichd,levels=c('term_neonatal',
'infancy','toddler','early_childhood',
'middle_childhood','early_adolescence',
'late_adolescence')),
signal = if_else(gam_score_90mse>0,gam_score_90mse,eps))
plot_tmp$DE_cut <-
cut(plot_tmp$DE,breaks = c(0,1,5,50,as.integer(max(plot_tmp$DE))),include.lowest = T)
pos <- position_dodge2(width = 0.7)
p <- plot_tmp %>%
ggplot(aes(nichd,signal,group=ade)) +
geom_line(alpha=0.2,position = pos) +
geom_jitter(aes(fill=DE_cut),pch=21,size=3,position = pos) +
guides(fill=guide_legend(title='Number of Reports',
title.position = 'top')) +
scale_color_brewer(palette = 'Set1') +
scale_fill_viridis_d() +
scale_y_sqrt() +
labs(x="Number of Reports",
y='Statistical Signal (lower bound)') +
facet_wrap(~cluster_name,ncol=2) +
theme_linedraw(base_size = 16) +
theme(
axis.text.x = element_text(angle=45,vjust=1,hjust=1),
legend.position = 'top'
)
p
})
names(items) <- soc_categories
maketabs(items)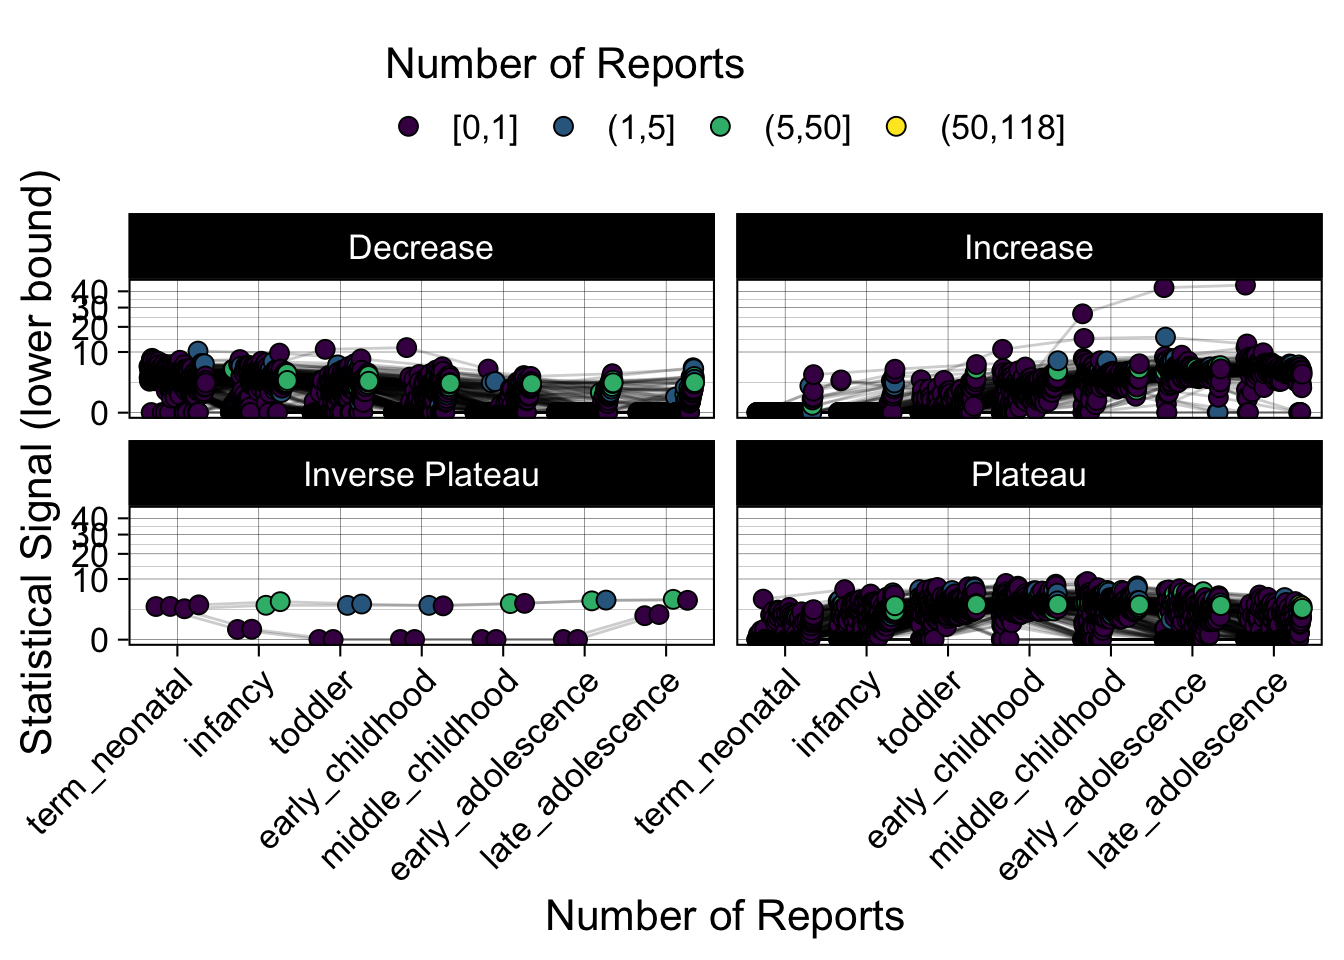
Phew, that was a lot of information! No worries, feel free to look through the {kidsides} website and the vignettes. Hopefully you will see it is easy to access and extract data from this database.
There are so many questions, visualizations, and analyses to be made with this data. I hope this short post provides a sneak peak into the database to wet your palette for more explorations. If you use this database in your work, I would love to hear about it!
kidsides::disconnect_sqlite_db(con)References
1.
Giangreco NP, Tatonetti NP. A database of pediatric drug effects to evaluate ontogenic mechanisms from child growth and development. Med (N. Y.). 2022;3(8):579–595.e7.